Data analysis starting with python (data visualization 1)
Introduction
This is the first post of CEML (Clinical Engineer Machine Learning). This time I would like to explain data analysis with python for beginners. Source code https://gitlab.com/ceml/qiita/-/blob/master/src/python/notebook/first_time_data_analysis.ipynb
Contents of this article
We will explain from reading data to simple data analysis using a dataset that is open to the public for free.
About the dataset
・ Provided by: California Institute of Technology ・ Contents: Test data of heart disease patients ・ URL: https://archive.ics.uci.edu/ml/datasets/Heart+Disease -Use only processed.cleveland.data in the above URL.
Analysis purpose
The dataset classifies the patient's condition into five classes. I will proceed with the analysis for the purpose of grasping the characteristics of each class.
Download data
Access the above URL and download processed.cleveland.data in the Data Folder.
Data reading
Import pandas and read the data with pandas' read_csv method. The column name is specified when reading the data. Make a list of column names and pass it as an argument to nemes of the read_csv method.
import pandas as pd
columns_name = ["age", "sex", "cp", "trestbps", "chol", "fbs", "restecg", "thalach", "exang", "oldpeak","slope","ca","thal","class"]
data = pd.read_csv("/Users/processed.cleveland.data", names=columns_name)
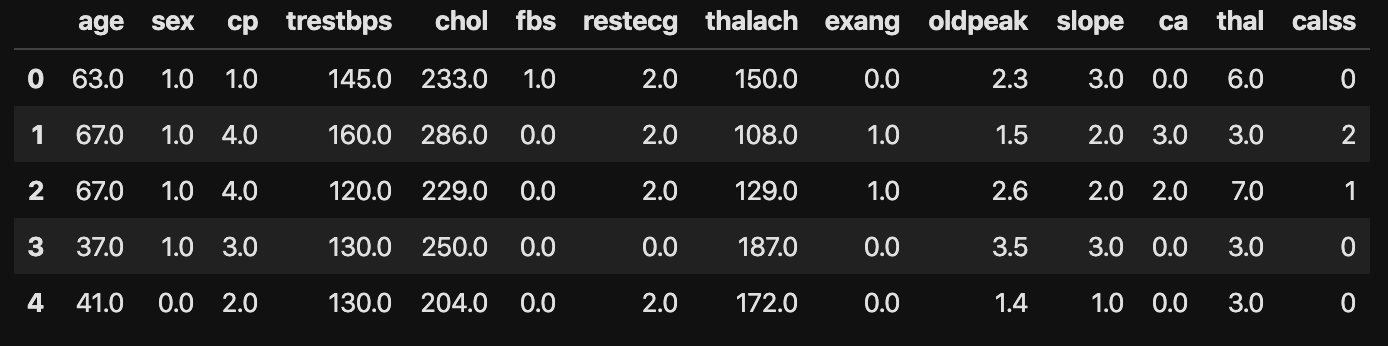
#Display the top 5 lines of data
data.head()
The following is the read data.
 Here is a brief description of the column. Please refer to the data source for details.
・ Raise
・ Sex (1 = male; 0 = female)
・ Cp: chest pain type
1:typical angina 2: atypical angina 3: non-anginal pain
4: asymptomatic
・ Trestbps: resting blood pressure (in mm Hg on admission to the hospital)
・ Chol: serum cholestoral in mg / dl
・ Fbs: fasting blood sugar> 120 mg / dl) (1 = true; 0 = false)
・ Restecg: resting electrocardiographic results
0: normal
1: having ST-T wave abnormality
(T wave inversions and/or ST elevation or depression of > 0.05 mV)
2: showing probable or definite left ventricular hypertrophy by Estes'criteria
・ Thalach: maximum heart rate achieved
・ Exang: exercise induced angina (1 = yes; 0 = no)
・ Oldpeak: ST depression induced by exercise relative to rest
・ Slope: the slope of the peak exercise ST segment
1: upsloping
2: flat
3: downsloping
・ Ca: number of major vessels (0-3) colored by flourosopy
・ Thal: 3 = normal; 6 = fixed defect; 7 = reversable defect
・ Class: 0 ~ 5 (0 is normal, the larger the number, the worse)
Here is a brief description of the column. Please refer to the data source for details.
・ Raise
・ Sex (1 = male; 0 = female)
・ Cp: chest pain type
1:typical angina 2: atypical angina 3: non-anginal pain
4: asymptomatic
・ Trestbps: resting blood pressure (in mm Hg on admission to the hospital)
・ Chol: serum cholestoral in mg / dl
・ Fbs: fasting blood sugar> 120 mg / dl) (1 = true; 0 = false)
・ Restecg: resting electrocardiographic results
0: normal
1: having ST-T wave abnormality
(T wave inversions and/or ST elevation or depression of > 0.05 mV)
2: showing probable or definite left ventricular hypertrophy by Estes'criteria
・ Thalach: maximum heart rate achieved
・ Exang: exercise induced angina (1 = yes; 0 = no)
・ Oldpeak: ST depression induced by exercise relative to rest
・ Slope: the slope of the peak exercise ST segment
1: upsloping
2: flat
3: downsloping
・ Ca: number of major vessels (0-3) colored by flourosopy
・ Thal: 3 = normal; 6 = fixed defect; 7 = reversable defect
・ Class: 0 ~ 5 (0 is normal, the larger the number, the worse)
Data preprocessing
This time, as preprocessing, check the data type of each column, and if it is not a numeric type, convert it to a numeric type. There is a missing value entered as?, So replace it with null.
#Check data type
data.dtypes

#Convert type to float ,? Replaced with a null value
data = data.replace("?",np.nan).astype("float")
Check the basic statistics and missing values of the data
Confirmation for each feature (variable)
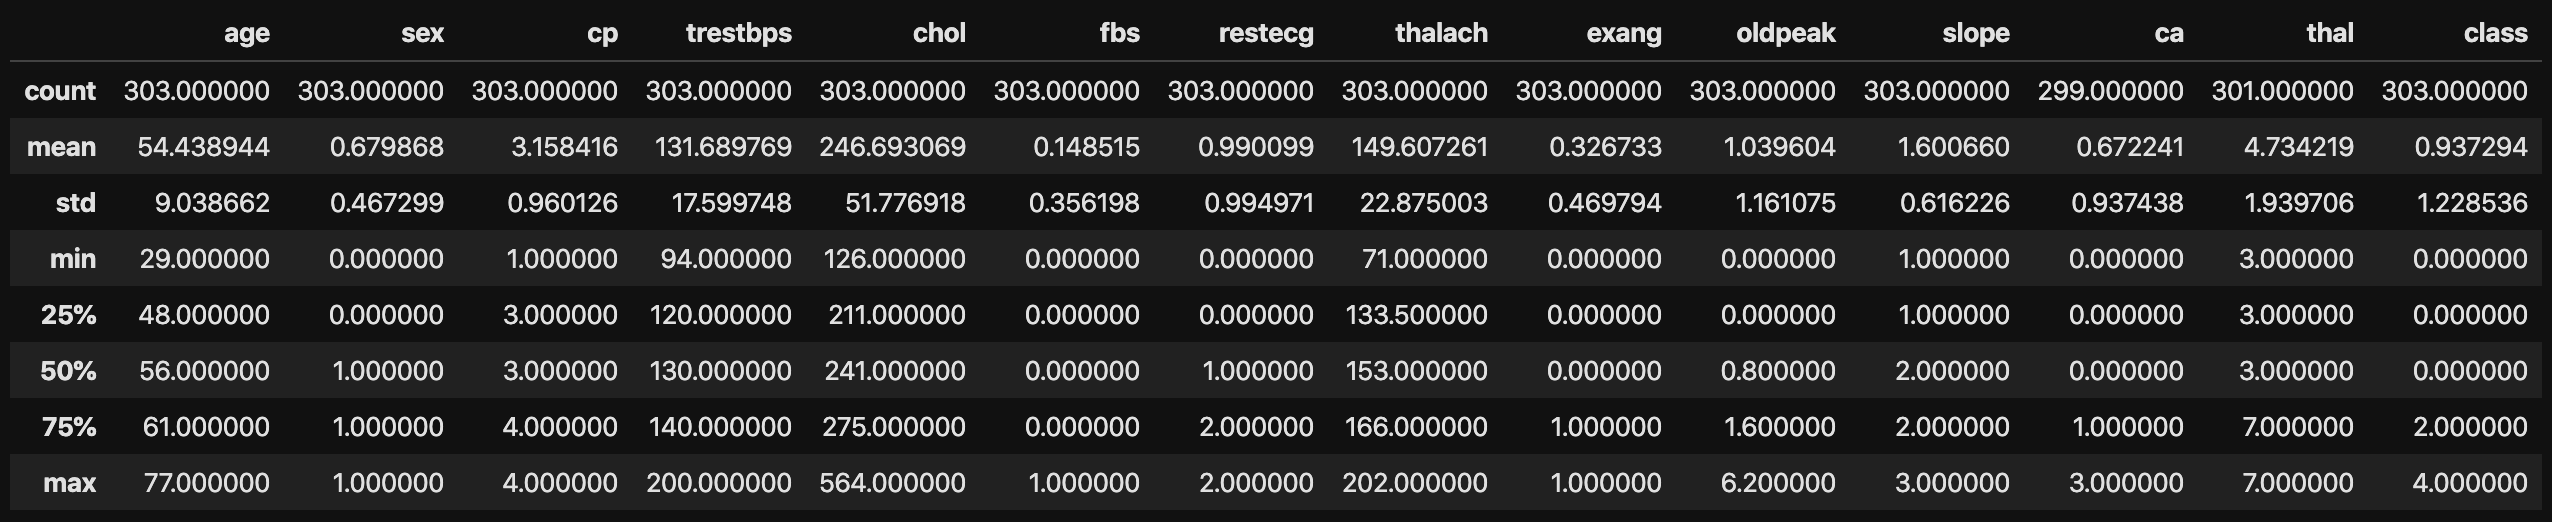
#Calculate statistics
data.describe()
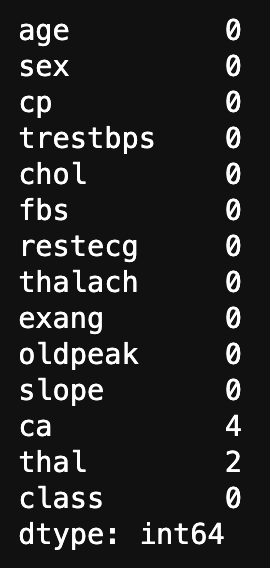
#Count missing values
data.isnull().sum()
With just this, you can see the missing values in the statistics for each column.
The figure below shows the calculation results of the statistics.
Confirmation of each feature (variable) for each class
Here is the main issue. As a confirmation, the purpose of this analysis is to understand the characteristics of each class. In this case, use the pandas group_by method.
#Group by class column
class_group = data.groupby("class")


#When you specify a class and get statistics
# class_group.get_group(0).describe()

#Specify options so that all columns can be displayed (notebook)
pd.options.display.max_columns = None
#Statistic display for all classes
class_group.describe()
The following shows the statistics for all classes.
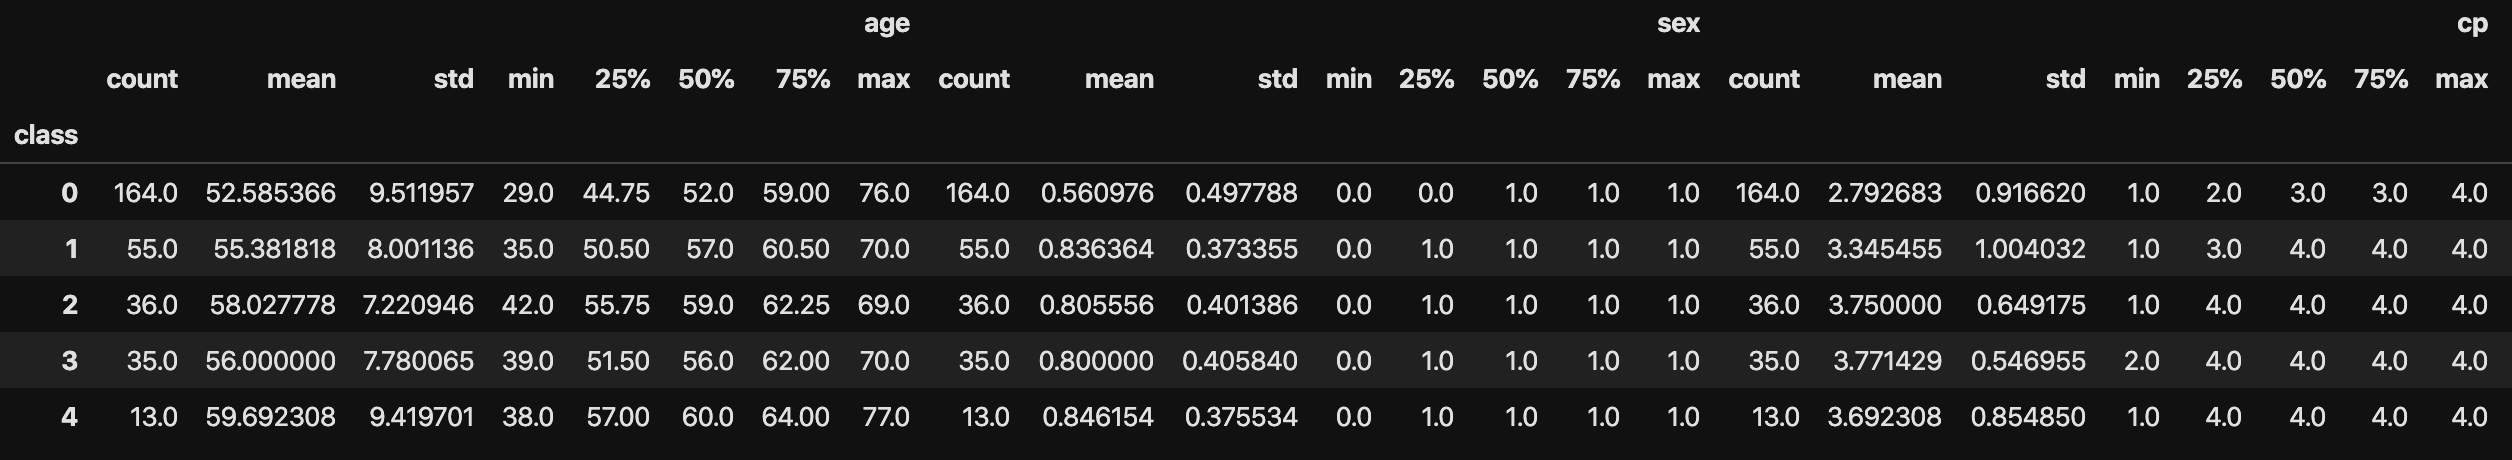
It's easy. Since the features (variables) and the number of classified classes (5) are small in this data, it can be confirmed by displaying the statistics of all classes, but if there are many of these, display all and confirm. Things get harder.
Visualize data
Check the distribution of each feature (variable)
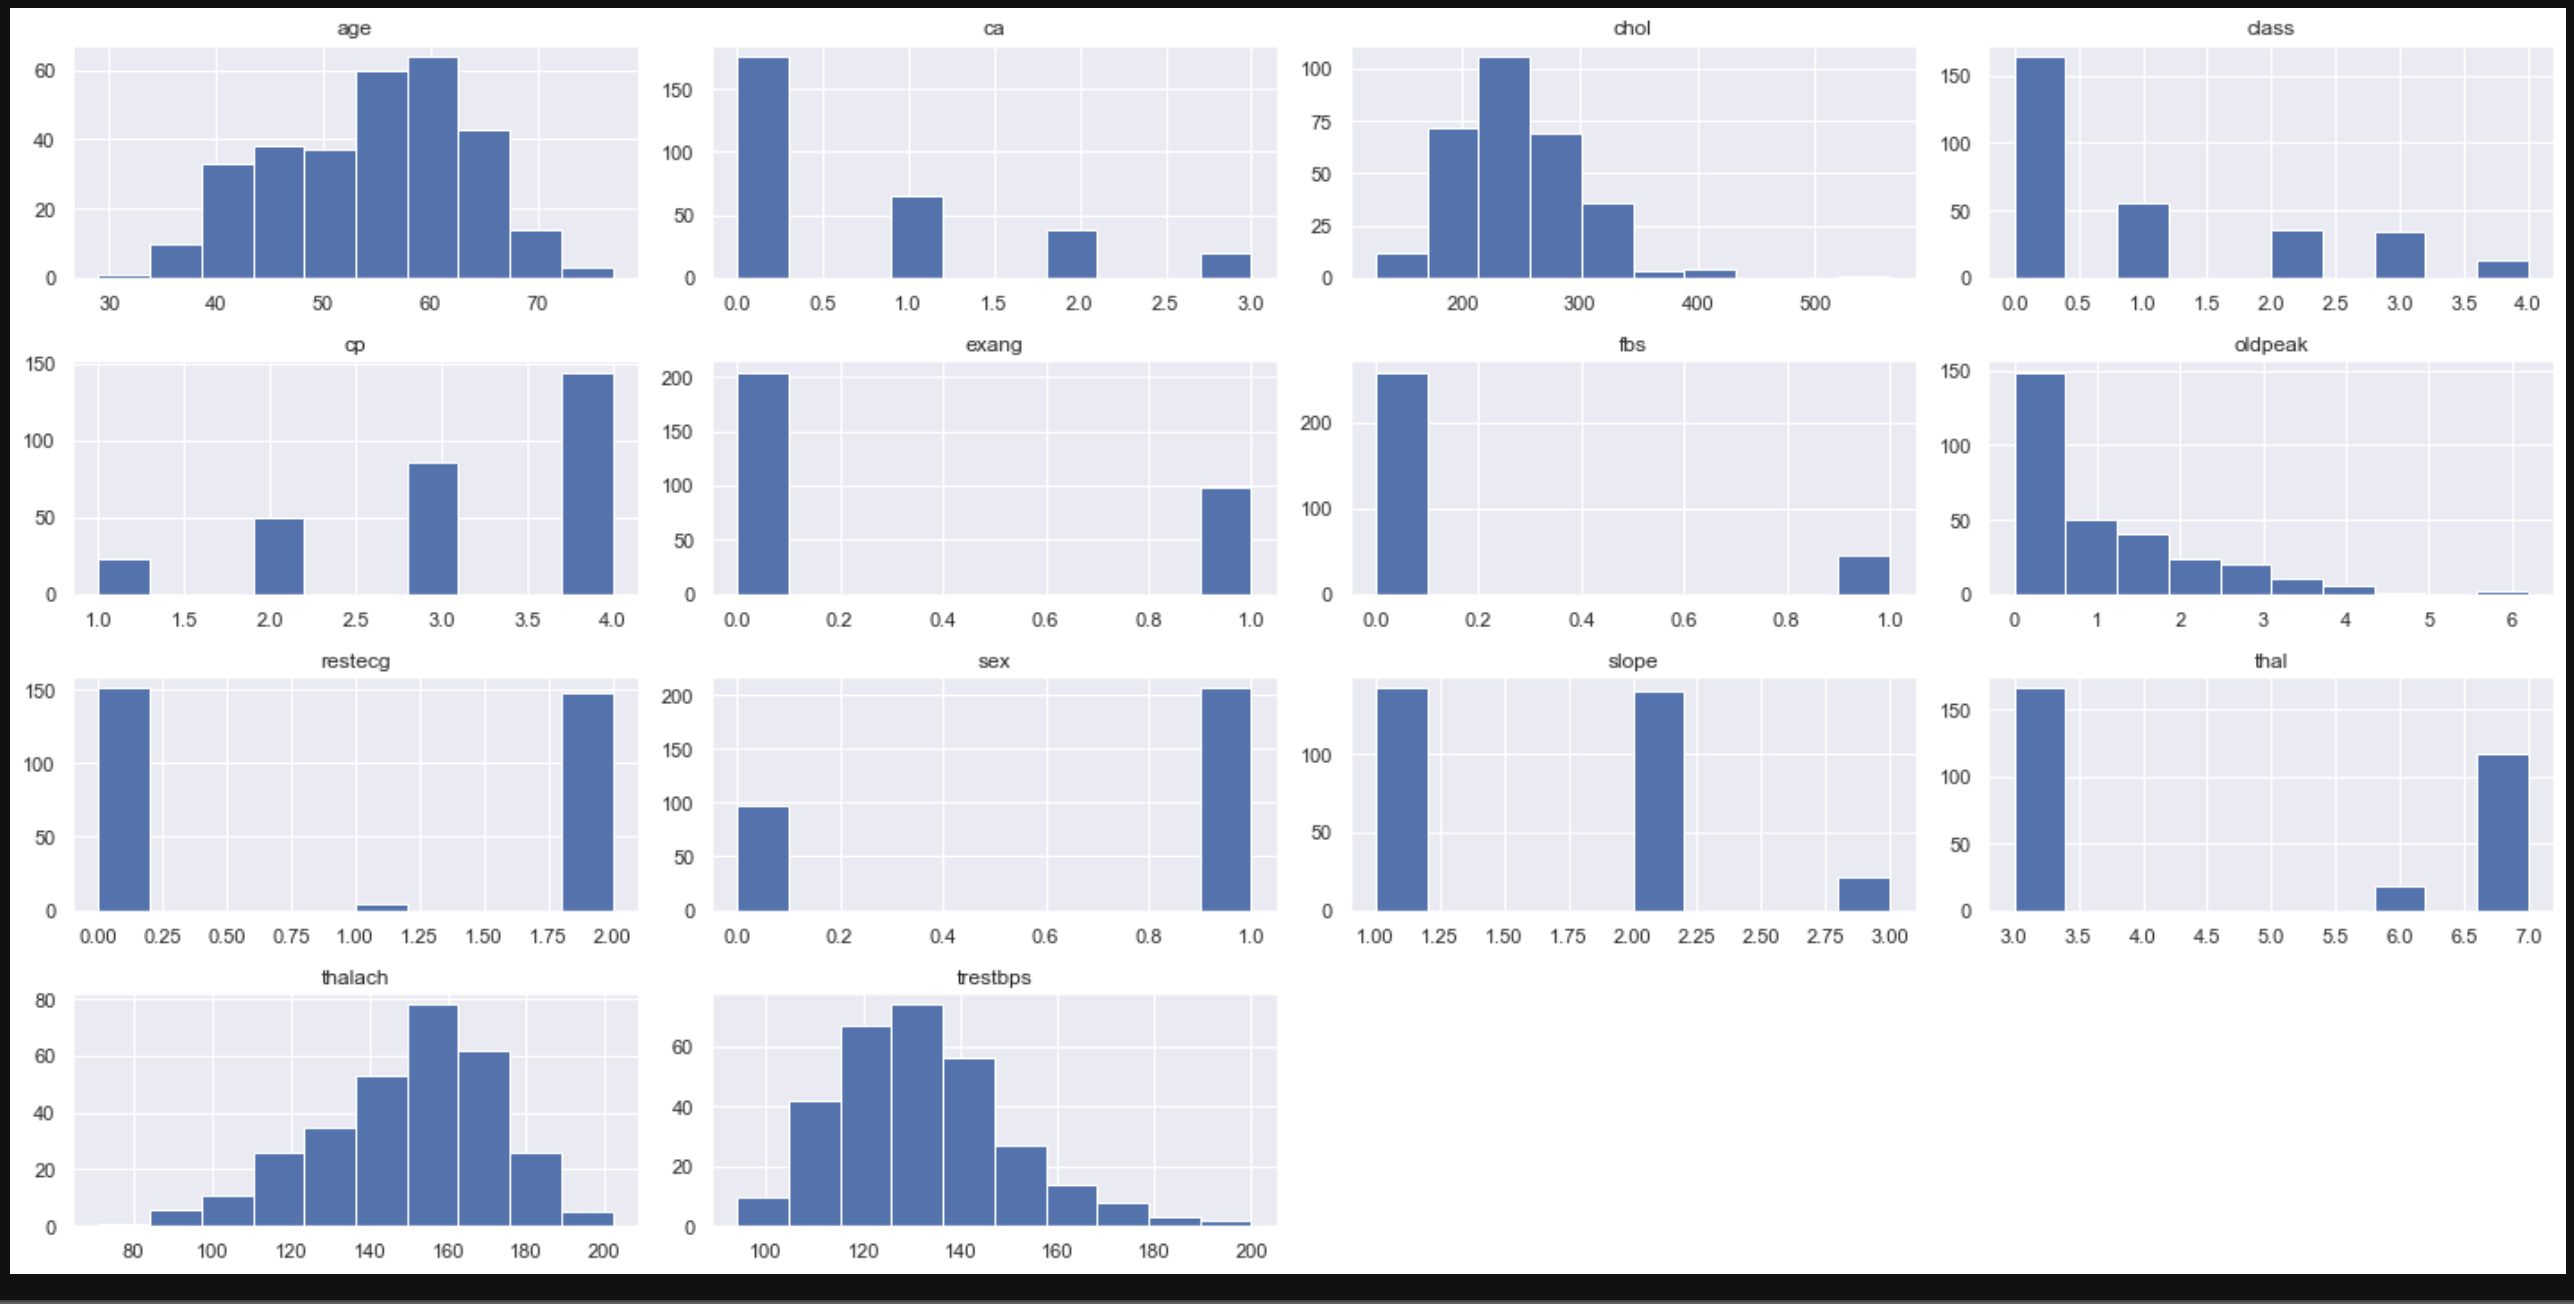
Check the distribution of the data in the histogram.
data.hist(figsize=(20,10))
#Prevent the graphs from overlapping
plt.tight_layout()
plt.show()
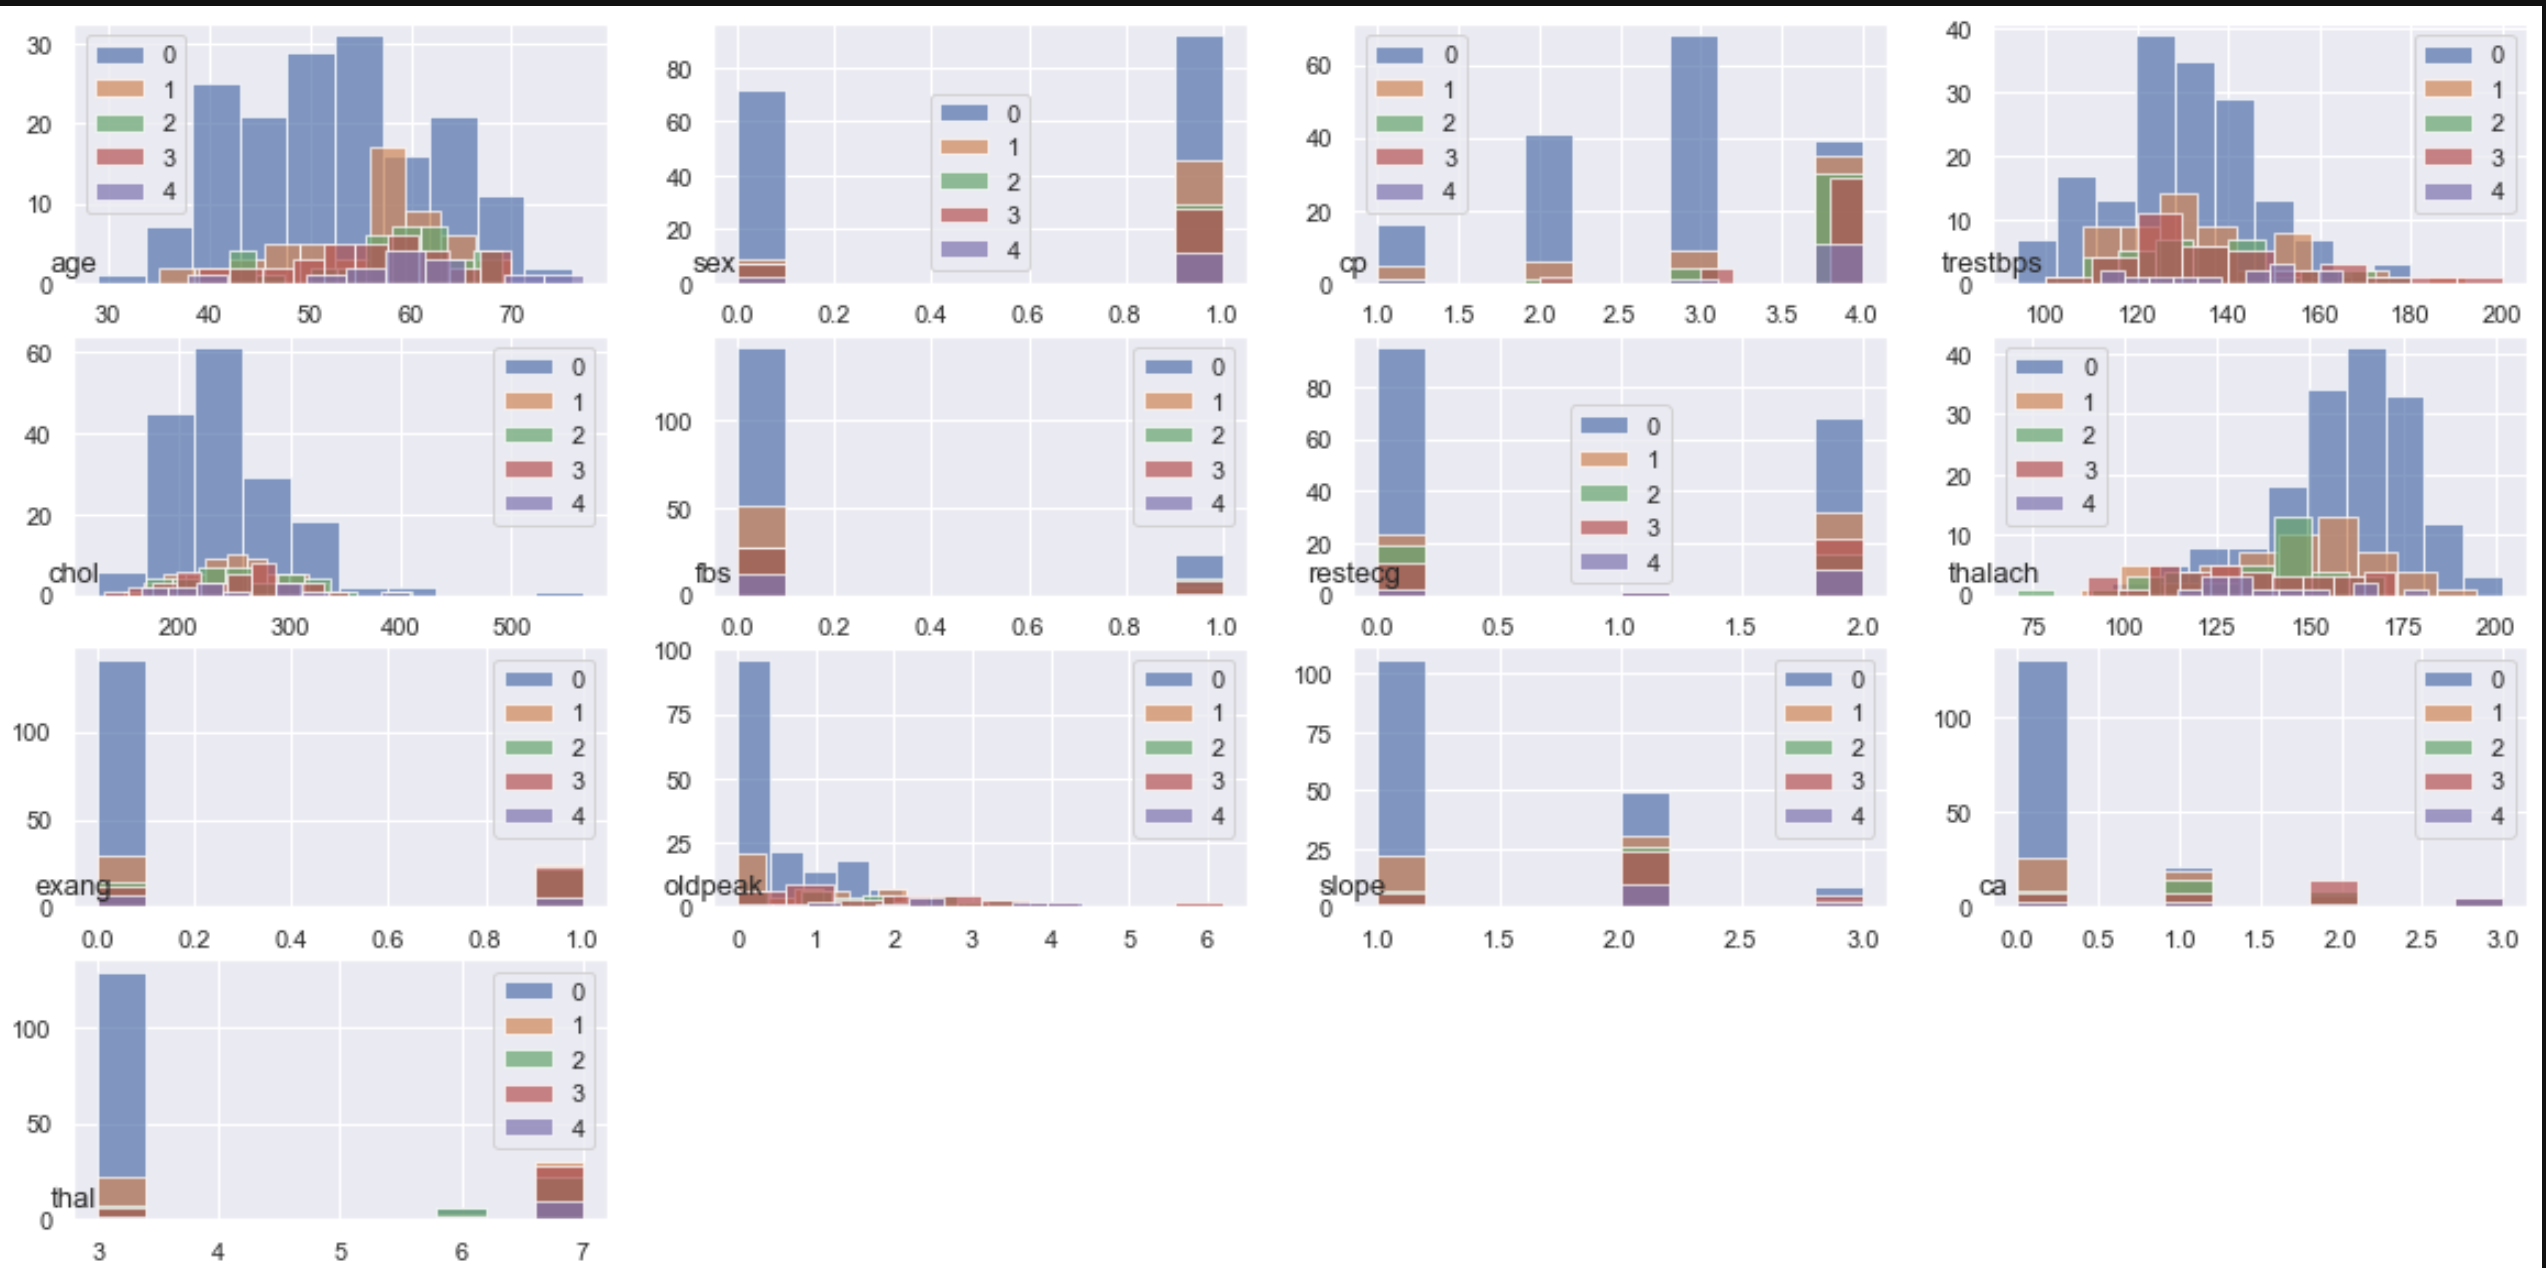
Display a histogram of each feature (variable) for each class
#Plot by itself
# class_group["age"].hist(alpha=0.7)
# plt.legend([0,1,2,3,4])

#Show all
plt.figure(figsize=(20,10))
for n, name in enumerate(data.columns.drop("class")):
    plt.subplot(4,4,n+1)
    class_group[name].hist(alpha=0.7)
    plt.title(name,fontsize=13,x=0, y=0)
    plt.legend([0,1,2,3,4])
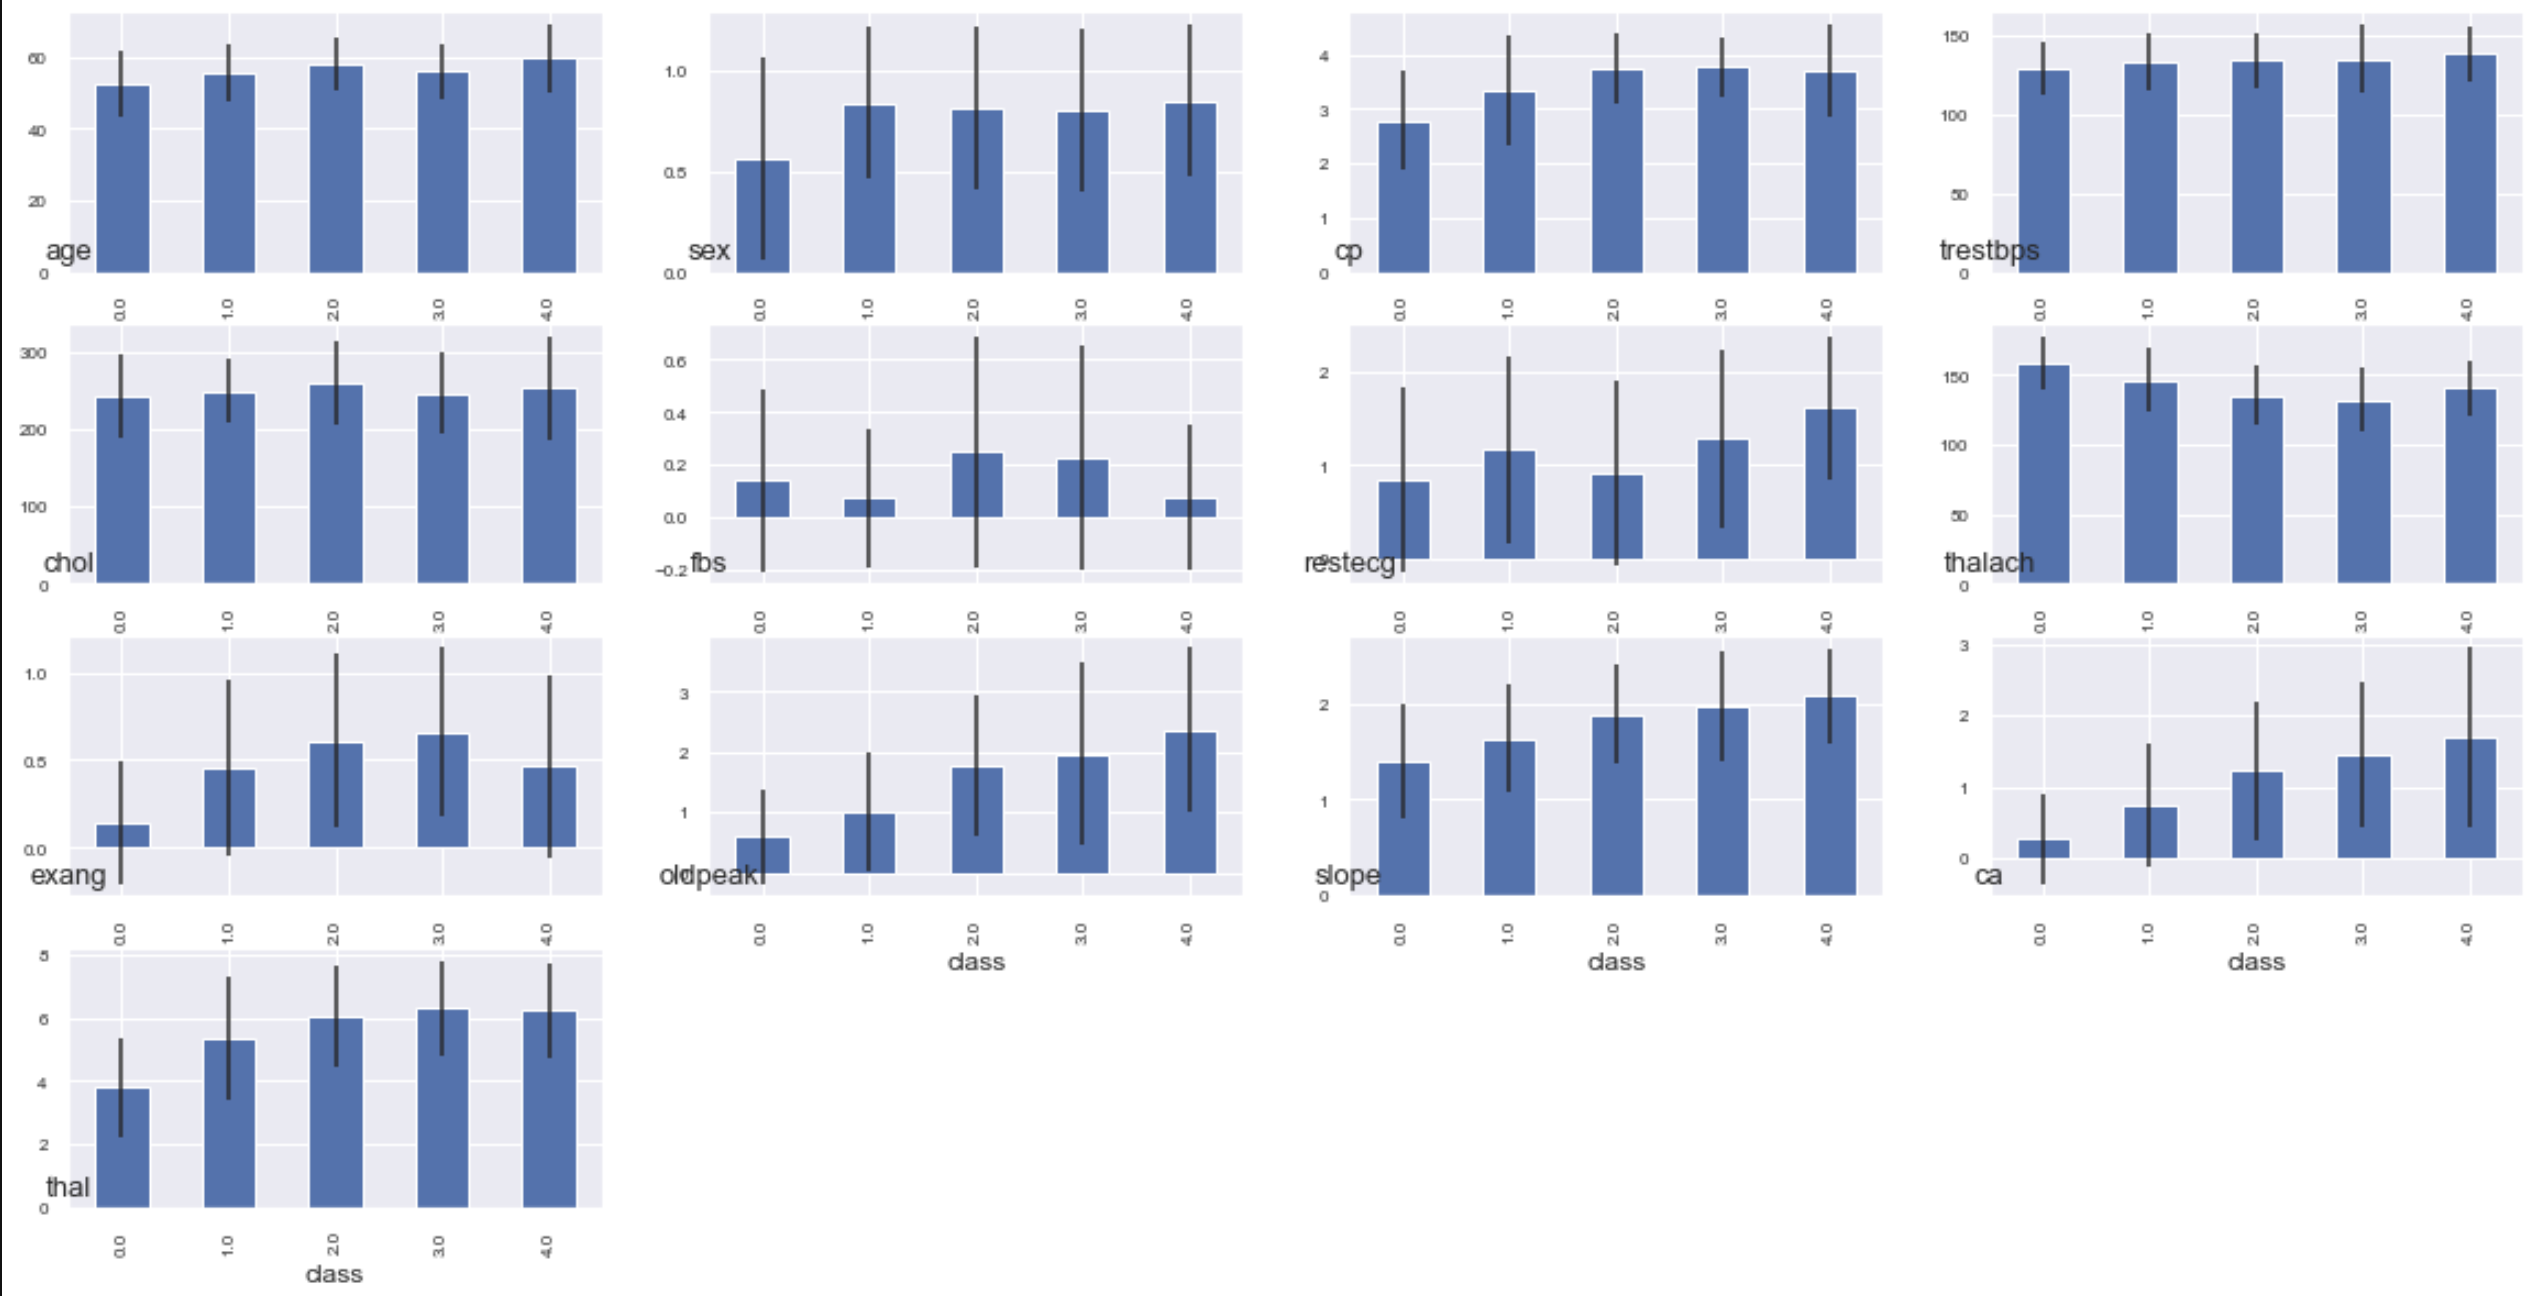
Display the mean and variance of each feature (variable) for each class on a bar graph
#Plot by itself
# class_group.mean()["age"].plot.bar(yerr=class_group.std()["age"])

#Show all
plt.figure(figsize=(20,10))
for n, name in enumerate(data.columns.drop("class")):
    plt.subplot(4,4,n+1)
    class_group.mean()[name].plot.bar(yerr=class_group.std()[name], fontsize=8)
    plt.title(name,fontsize=13,x=0, y=0)
I tried to visualize it roughly, but the histogram for each class cannot be seen well as it is. Next time, I will analyze using graphs that can be moved and 3d plots.
Data analysis starting with python (data visualization 2) https://qiita.com/CEML/items/e932684502764be09157 Data analysis starting with python (data visualization 3) https://qiita.com/CEML/items/71fbc7b8ab6a7576f514
Recommended Posts