Preprocessing template for data analysis (Python)
Preprocessing template for data analysis (Python)
The data preprocessing that I often use is summarized below in template format. The description is a template, without much explanation.
Data set loading
Read csv format
read_data.py
trainval_filename = './train.csv'
test_filename = './test.csv'
df_trainval = pd.read_csv(trainval_filename)
df_test = pd.read_csv(test_filename)
Combine dataframes with concat
This is convenient when you want to preprocess training data and test data all at once. After that, use it when you want to combine data normally.
df_all = pd.concat([df_trainval,df_test],axis=0)
#axis=0 :Connect downward
#axis=1 :Connect to the right
Simple variable conversion
Processing of date and time information by to_datatime
Convert date and time information to Timestamp type, convert to year / month / date / day of the week
'''
#Before conversion
     Date
0   1999-07-17
1   2008-02-14
2   2013-03-09
3   2012-02-02
4   2009-05-09
'''
df_all['Date'] = pd.to_datetime(df_all["Date"])
'''
#After treatment
0   1999-07-17
1   2008-02-14
2   2013-03-09
3   2012-02-02
4   2009-05-09
'''
Information conversion to date and day of the week by apply
The same thing can be done using map.
df_all['Year'] = df_all['Date'].apply(lambda x:x.year)
df_all['Month'] = df_all['Date'].apply(lambda x:x.month)
df_all['Day'] = df_all['Date'].apply(lambda x:x.day)
df_all['Weekday_name'] = df_all['Date'].apply(lambda x:x.weekday_name)

'''
#After conversion
   Year  Month  Day Weekday_name
0  1999      7   17  Saturday
1  2008      2   14  Thursday
2  2013      3    9  Saturday
3  2012      2    2  Thursday
4  2009      5    9  Saturday
'''
Numerical conversion of labels by LabelEncoder
Convert labels to numeric information. Below, the city information is converted to numerical information.
laberlencoder.py
from sklearn.preprocessing import LabelEncoder

le = LabelEncoder()
df_all['City'] = le.fit_transform(df_all['City'])
Element replacement by map
Convert the label to a discrete value using the map function.
map.py
'''
   City Group Type
0  Big Cities   IL
1  Big Cities   FC
2       Other   IL
3       Other   IL
4       Other   IL #Before conversion
'''

df_all['City Group'] = df_all['City Group'].map({'Other':0,'Big Cities':1}) #There are only 'Other' or 'Big city'
df_all["Type"] = df_all["Type"].map({"FC":0, "IL":1, "DT":2, "MB":3}) #There are only 'FC' or 'IL' or 'DT' or 'MB'
'''
   City Group  Type
0           1     1
1           1     0
2           0     1
3           0     1
4 0 1 After conversion
'''
Acquisition of data information using pandas functions
Get column information using info ()
You can get the number of columns, column length, data type, etc. Very convenient
df.info()
'''<class 'pandas.core.frame.DataFrame'>
RangeIndex: 891 entries, 0 to 890
Data columns (total 12 columns):
PassengerId    891 non-null int64
Survived       891 non-null int64
Pclass         891 non-null int64
Name           891 non-null object
Sex            891 non-null object
Age            714 non-null float64
SibSp          891 non-null int64
Parch          891 non-null int64
Ticket         891 non-null object
Fare           891 non-null float64
Cabin          204 non-null object
Embarked       889 non-null object
dtypes: float64(2), int64(5), object(5)
memory usage: 83.6+ KB
None
'''
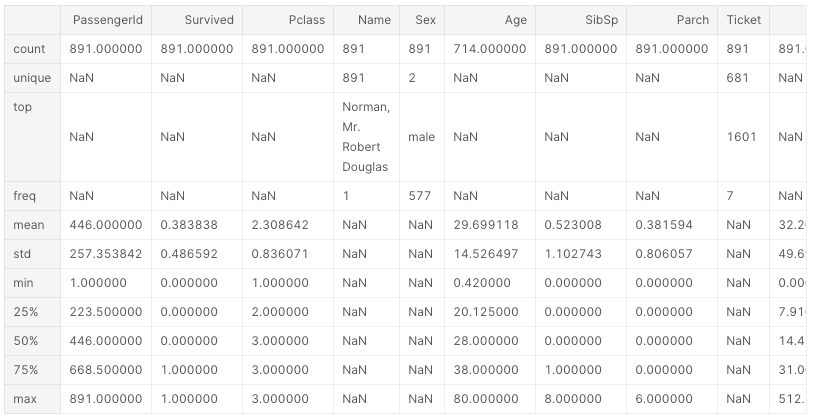
describe() Various information such as the number of data in each column, mean, variance, and quartile can be obtained.
df.describe()
NaN aggregation
df.isnull().sum()
'''
PassengerId      0
Survived         0
Pclass           0
Name             0
Sex              0
Age            177
SibSp            0
Parch            0
Ticket           0
Fare             0
Cabin          687
Embarked         2
Family_size      0
'''
Fill NaN
There are various ways to fill it. Personally, I use it only around the average and median. If there is another good way, please let me know.
df['Age'].fillna(dataset['Age'].median()) #Median version
df['Age'].fillna(dataset['Age'].median()) #Mean version

df = df.dropna(how='all',axis=0) #Columns with all values missing are deleted,axis=Set to 1 for lines.
df = df2.dropna(how='any',axis=0) #'any'If set to, lines containing even one NaN will be deleted. (Default)
Correlation coefficient by corr ()
The correlation coefficient between all variables can be calculated simply by using corr (). Very convenient.
print(df.corr())
'''
             PassengerId    Pclass       Age     SibSp     Parch      Fare
PassengerId     1.000000 -0.026751 -0.034102  0.003818  0.043080  0.008211
Pclass         -0.026751  1.000000 -0.492143  0.001087  0.018721 -0.577147
Age            -0.034102 -0.492143  1.000000 -0.091587 -0.061249  0.337932
SibSp           0.003818  0.001087 -0.091587  1.000000  0.306895  0.171539
Parch           0.043080  0.018721 -0.061249  0.306895  1.000000  0.230046
Fare            0.008211 -0.577147  0.337932  0.171539  0.230046  1.000000
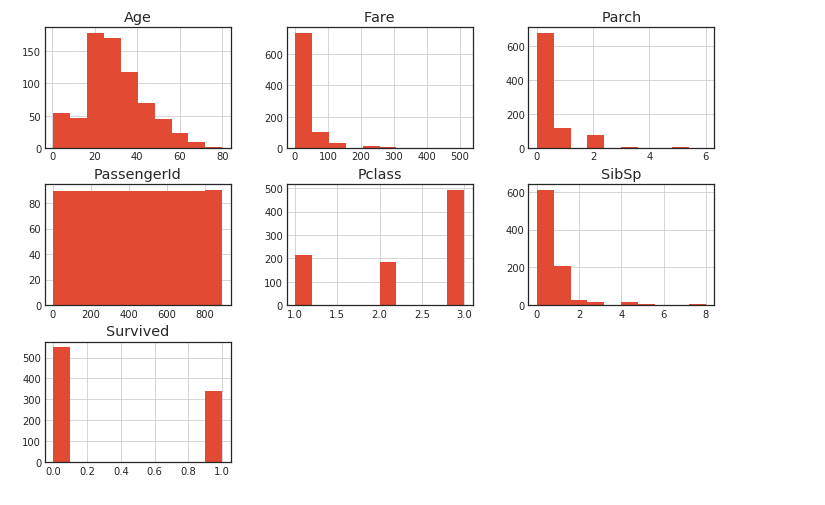
Histogram creation with hist ()
Just use hist () and it will draw a histogram. This is also very convenient.
df.hist()
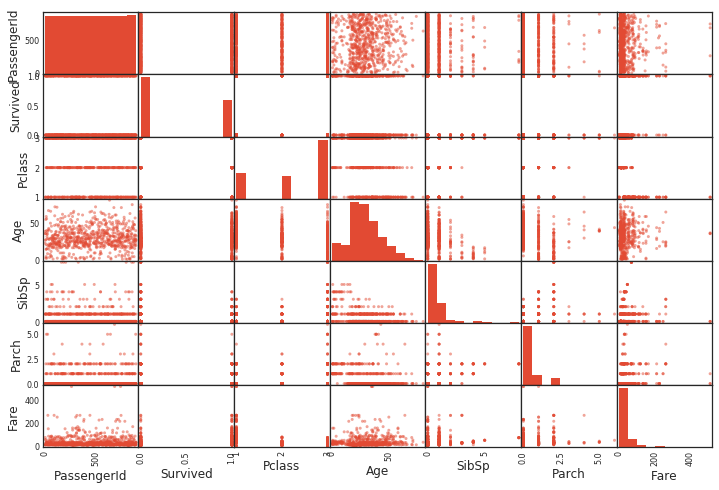
Scatter plot creation with scatter_matrix ()
Scatter_matrix () draws a scatter plot. It creates a scatter plot between all variables. The diagonal diagram depicts a histogram of the variables.
pd.plotting.scatter_matrix(df)
Grouping by group by
The groupby function can be applied to label variables. 'Sex' has only female and male, so it can be divided into these two If you add mean () after this, the average will be calculated for each group.
print(df[['Sex', 'Survival']].groupby('Sex', as_index=False).mean())
'''
      Sex  Survived
0  female  0.742038
1    male  0.188908
'''
I'm editing now.
Recommended Posts