[PYTHON] Data analysis Titanic 3
Aidemy 2020/10/31
Introduction
Hello, it is Yope! I am a liberal arts student, but I was interested in the possibilities of AI, so I went to the AI-specialized school "Aidemy" to study. I would like to share the knowledge gained here with you, and I am summarizing it on Qiita. I am very happy that many people have read the previous summary article. Thank you! This is the third post of "Data Analysis Titanic". Nice to meet you.
- This article is a summary of what you learned in "Aidemy" "in your own words". It may contain mistakes and misunderstandings. Please note.
What to learn this time ・ ⑤ Problem modeling, prediction, and solution
Creating a model
Selection of algorithm to use
-Since the data processing is completed in Chapter 2, from here, we will actually pass the data to the __ model, make a prediction, and perform the process until it is resolved. -First, it is necessary to decide __ which algorithm to create the model __. There are __ "classification" and "regression" __ in the prediction problem. The former divides the data into classes and predicts which "class" the passed data belongs to, and the latter is the "value" of the data. Is to predict. -The prediction problem for this Titanic issue is to "classify" whether __Survived is 0 or 1. The algorithm used is __ "logistic regression" "SVC" "k-NN" "decision tree" "random forest" __ to create a model.
Data preparation
-Prepare __ "X_train" "y_train" "X_test" __ to be passed to the model. I usually use __train_test_split () __ in sklearn.model_serection, but this time I split it myself . -For X_train, substitute train_df other than Survived, for y_train, substitute train_df for Survived only, and for X_test, substitute test_df other than __PassengerId.
・ Code
Logistic regression
・ (Review) __Logistic regression __ uses the __sigmoid function __ to classify binary values. The sigmoid function is a function __ that takes a value between __0 and 1. Create a model using __LogidticRegression () __. -This time, predict whether the objective variable __Survived is 0 or 1 using the explanatory variables Age and Pclass.
-Also, as for the data to be passed to the model, only logistic regression uses __X_train and Y_train divided into training data and test data at a ratio of 8: 2.
-Code (including results)
Visualize which explanatory variables (features) are likely to influence the results
-__ To know "which explanatory variable (feature amount) tends to influence the result" __, calculate the _partial regression coefficient __ between the objective variable and the explanatory variable. It can be said that the larger the value, the easier it is to influence the result. -Calculate the partial regression coefficient with __ "model.corf" __. Since I want to handle it in DataFrame, I create a DataFrame that has train_df columns in the row ("Feature"), create a "Partial regression coefficient" as a new column, and store the partial regression coefficient there. -The reason why delete (0) is set when creating a DataFrame is that if 0 appears in the process of calculating the partial regression coefficient, the calculation cannot be performed and it becomes NaN.
-Code
・ Result
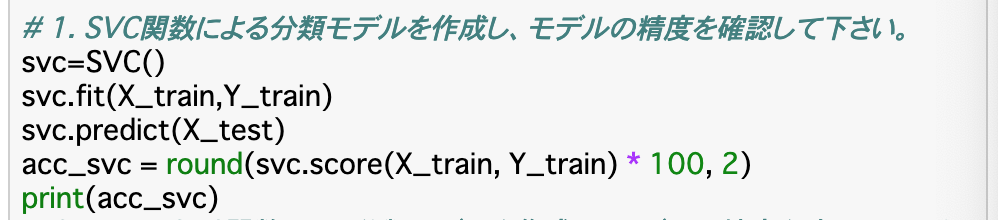
SVM -(Review) __ Support Vector machine (SVM) __ An algorithm for classification. Since the classification boundary is drawn so that it is the farthest from other classes, it is easy to be generalized __. Since the kernel method __ is used to convert from non-linear to linear, __ can handle non-linear data. Linear SVM is used with __LinearSVC () __ and non-linear SVM is used with __SVC () __.
・ Code (If you create LinearSVC in the same way, it's OK. This result is "83.84")
k-NN -(Review) k-NN is an algorithm that extracts k teacher data similar to prediction data __ and outputs the most common class as the prediction result. The feature is that the learning cost is 0 and the prediction accuracy is high __. It can be used with __KNeighborsClassifier () __, and the number k of data to be extracted can be set by specifying __ "n_neighbors" __ as an argument.
・ Code
Decision tree
-(Review) Decision tree is named like this because the rules extracted from the data are represented by a tree structure. The rule is, for example, that if the explanatory variable Age is 1 (16 to 32 years old), it is judged for Pclass. As these progress, the classes can be finally classified. Can be used with __DecisionTreeClassifier () __.
Random forest
-(Review) __Random Forest __ is an algorithm that builds a large number of decision trees __ and outputs the largest number of each result as the final result. Learning using multiple classifiers like this is called ensemble learning. It can be used with __RandomForestClassifier () __, and the number of decision trees can be determined by specifying __ "n_estimators" __ as an argument.
Evaluation of the model
-By listing the accuracy (acc) __ of each __model created above in DataFrame, decide which model should be used.
-Code
・ Result
Save model
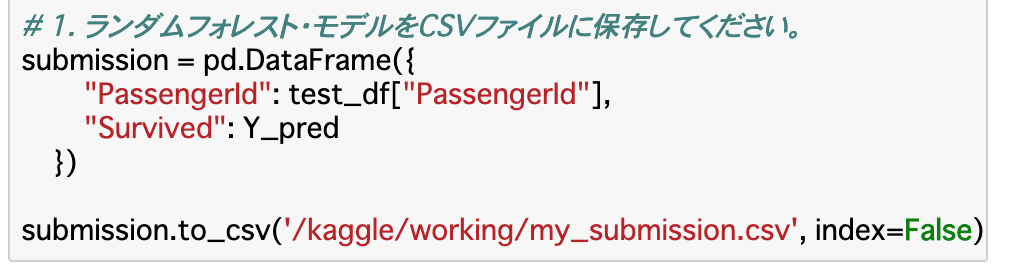
-As seen in the results in the previous section, it was found that the accuracy of the model using the __decision tree and random forest is the highest __. This time, I decided to use the __random forest model, which seems to be more generalized, and save this model as a csv file. -You can write and save csv files with __ "to_csv" __. In the file, create a file as a DataFrame that has a column that stores the PassengerId of test_df as'PassengerId'and a column that stores the prediction result'Y_pred' of the random forest (decision tree) as'Survived'.
・ Code (file path is fictitious)
Summary
-Split the data created up to the last time into __train_X, train_y, test_X . Create a model using these data. - In order to know "which explanatory variable (feature amount) tends to influence the result" __, it is better to calculate and visualize the __partial regression coefficient __. -Compare which model has the highest __accuracy (acc) __ from the score of each model, and save the highest __accuracy (acc) __ in a csv file.
This time is over. Thank you for reading until the end.
Recommended Posts