[Python] First data analysis / machine learning (Kaggle)
Introduction
When I was about to get a job (spring break in my fourth year at university), I suddenly wanted to become a data scientist, so I started working on Kaggle for the time being.
This time, I worked on the tutorial "** Titanic ** of ** Kaggle **. titanic / overview) "problem.
I have experience in statistical analysis in my research, but I don't understand machine learning at all, so I decided to study by referring to the code of the insanely excellent person!
By the way, here is the reference ✔︎Introduction to Ensembling/Stacking in Python This is the code that was described as "Most voted" in the Notebook. (As of March 10, 2020)
Also, I also referred to this article that referred to the above code lol Ensemble (Stacking) Learning & Machine Learning Tutorial in Kaggle with Python
Introduction The content of the Titanic competition that we are working on this time will be given data on passengers such as age, gender, number of people in the room, room class, life and death.
Based on that data ** Data preprocessing → Data visualization → Stacking model construction → Test data → Evaluation **
Finally, the life and death of passengers is predicted using a model constructed from test data. How well this prediction is also a measure of the score.
Since there is a lot of volume, this article will focus on ** "preprocessing" and "data visualization" **!
After building the model, I will post it in the next article! Click here for the sequel article ↓ ↓ ↓ [Python] First Data Analysis / Machine Learning (Kaggle) ~ Part2 ~
Now, let's start preprocessing the data! !!
Data preprocessing
Library import
Roughly the library used this time
--Mathematical and statistical processing: numpy, pundas --Regular expression operations (searching or replacing words or numbers in a specified form): re --I have various models ~: sklearn --Gradient boosting decision tree algorithm: XGboost --Graphs and figures: matplotlib, seaborn, plotly --Show / Hide Warnings: warnings ――Five basic models - RandomForestClassifier - AdaBoostClassifier - GradientBoostingClassifier - ExtraTreesClassifier - SVC --It is Kfold that applies these 5 model libraries at the same time.
import_library.py
import pandas as pd
import numpy as np
import re
import sklearn
import xgboost as xgb
import seaborn as sns
import matplotlib.pyplot as plt
%matplotlib inline

import plotly.offline as py
py.init_notebook_mode(connected=True)
import plotly.graph_objs as go
import plotly.tools as tls

import warnings
warnings.filterwarnings('ignore')

#5 models
from sklearn.ensemble import (RandomForestClassifier, AdaBoostClassifier,
                              GradientBoostingClassifier, ExtraTreesClassifier)
from sklearn.svm import SVC

#Adapt multiple machine learning libraries at the same time
from sklearn.cross_validation import KFold
Data acquisition
import_data.py
train = pd.read_csv('../input/train.csv')
test = pd.read_csv('../input/test.csv')

#Have the Passenger ID retain the passenger ID
PassengerId = test['PassengerId']

train.head(3)
output
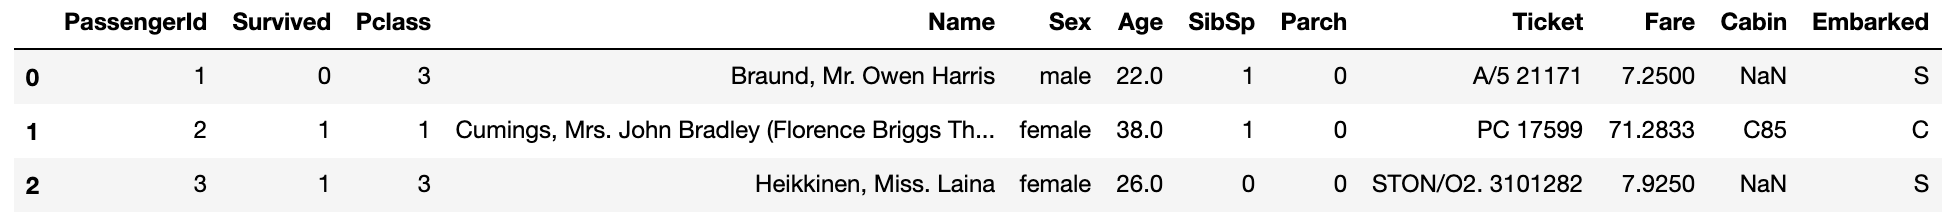
Data description
--PassengerId: Passenger ID --Survived: Life / Death flag (If you survive: 1, If you die: 0) --Pclass: Ticket class --Name: Passenger's name --Sex: Gender --Age: Age --SibSp: Brother / spouse on board --Parch: Parents / children on board --fare: fare --cabin: room number --Embarked: Port on board
Feature engineering
We will process the acquired data so that it can be easily analyzed. This ** pre-processing seems to be quite important ** in machine learning, so I'll do my best for a long time! !!
Basically, all missing values (no values) and character data are converted to numerical data.
FeatureEngineering.py
full_data = [train, test]

#Passenger name length
train['name_length'] = train['name'].apply(len)
test['name_length'] = test['name'].apply(len)

#1 if there is room number data, 0 if there is a missing value
train['Has_Cabin'] = train['Cabin'].apply(lambda x: 0 if type(x) == float else 1)
test['Has_Cabin'] = test['Cabin'].apply(lambda x: 0 if type(x) == float else 1)

#The size of the family is on board the Titanic"Brother/Number of spouses"When"parent/Number of children"Define from
for dataset in full_data:
    dataset ['FamilySize'] = dataset['Sibsp'] + dataset['Parch'] +1

#If you don't have a family"IsAlone"Is 1
for dataset in full_data:
    dataset['IsAlone'] = 0
    dataset.loc[dataset['FamilySize'] == 1, 'IsAlone'] = 1

#Most missing values at the port of departure'S'Keep
for dataset in full_data:
    dataset['Embarked'] = dataset['Embarked'].fillna('S')

#Set the median missing value of the charge
#Divide the fee into 4 groups
for dataset in full_data:
    dataset['Fare'] = dataset['Fare'].fillna(train['Fare'].median())
train['CategoricalFare'] = pd.qcut(train['Fare'], 4)

#Divide age into 5 groups
for dataset in full_data:
    age_avg = dataset['Age'].mean()
    age_std = dataset['Age'].std()
    age_null_count = dataset['Age'].isnull().sum()
    #List of random values to put in missing values
    #Use a value that is larger or smaller by the deviation from the average value
    age_null_random_list = np.random.randint(age_avg - age_std, age_avg + age_std, size = age_null_count)
    dataset['Age'][np.isnan(dataset['Age'])] = age_null_random_list
    #Convert data to int type
    dataset['Age'] = dataset['Age'].astype(int)

train['CategoricalAge'] = pd.qcut(train['Age'],5)

#Function get to retrieve name_Definition of title
def get_title(name):
    title_search = re.search('([A-Za-z]+)\.',name)
    #If there is a name, take it out and return it
    if title_search:
       return title_search.group(1)
    return ""

#Function get_use title
for dataset in ftll_data:
    dataset['Title'] = dataset['Name'].apply(get_title)

    #Correction of name entry mistakes
    dataset['Title'] = dataset['Title'].replace(['Lady', 'Countess','Capt', 'Col','Don', 'Dr', 'Major', 'Rev', 'Sir', 'Jonkheer', 'Dona'], 'Rare')

    dataset['Title'] = dataset['Title'].replace('Mlle', 'Miss')
    dataset['Title'] = dataset['Title'].replace('Ms', 'Miss')
    dataset['Title'] = dataset['Title'].replace('Mme', 'Mrs')

for dataset in full_data:
    #0 for women, 1 for men
    dataset['Sex'] = dataset['Sex'].map( {'female': 0, 'male': 1} ).astype(int)

    #Labeled 5 types of names
    title_mapping = {"Mr": 1, "Miss": 2, "Mrs": 3, "Master": 4, "Rare": 5}
    dataset['Title'] = dataset['Title'].map(title_mapping)
    dataset['Title'] = dataset['Title'].fillna(0)

    #Labeled on 3 types of departure points
    dataset['Embarked'] = dataset['Embarked'].map( {'S': 0, 'C': 1, 'Q': 2} ).astype(int)

    #Divide the fee into 4 groups
    dataset.loc[ dataset['Fare'] <= 7.91, 'Fare']                               = 0
    dataset.loc[(dataset['Fare'] > 7.91) & (dataset['Fare'] <= 14.454), 'Fare'] = 1
    dataset.loc[(dataset['Fare'] > 14.454) & (dataset['Fare'] <= 31), 'Fare']   = 2
    dataset.loc[ dataset['Fare'] > 31, 'Fare']                                  = 3
    dataset['Fare'] = dataset['Fare'].astype(int)

    #Divide age into 5 groups
    dataset.loc[ dataset['Age'] <= 16, 'Age']                          = 0
    dataset.loc[(dataset['Age'] > 16) & (dataset['Age'] <= 32), 'Age'] = 1
    dataset.loc[(dataset['Age'] > 32) & (dataset['Age'] <= 48), 'Age'] = 2
    dataset.loc[(dataset['Age'] > 48) & (dataset['Age'] <= 64), 'Age'] = 3
    dataset.loc[ dataset['Age'] > 64, 'Age'] = 4 ;

#Remove unnecessary features
drop_elements = ['PassengerId', 'Name', 'Ticket', 'Cabin', 'SibSp']
train = train.drop(drop_elements, axis = 1)
train = train.drop(['CategoricalAge', 'CategoricalFare'], axis = 1)
test  = test.drop(drop_elements, axis = 1)
Coding that I learned
--How to use the lambda function
- fillna() --pandas qcut --map function --Enter the value only if True in [] of loc [] without using if statement
- axis = 1
Data visualization
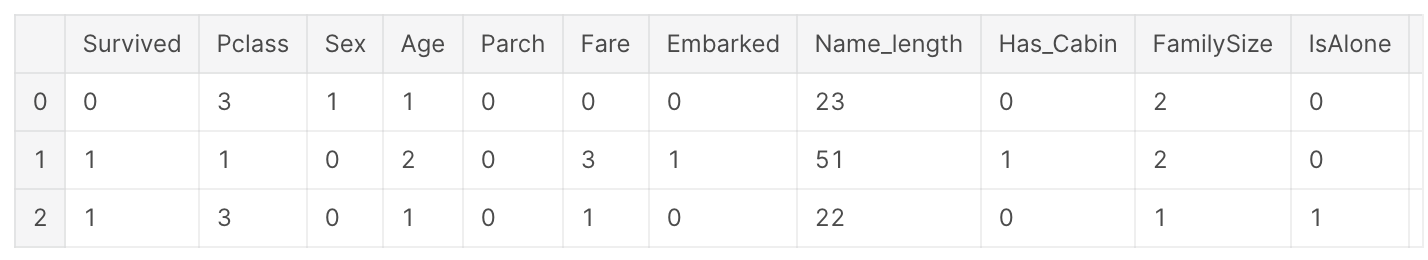
Finally the pre-processing is over! !! Let's check if all the data is numerical data!
visualize.py
train.head(3)
Pearson Correlation Heatmap
Check the correlation between features on the heat map.
heatmap.py
colormap = plt.cm.RdBu
plt.figure(figsize = (14,12))
plt.title('Peason Correlation of Features', y = 1.05, size = 15)
sns.heatmap(train.astype(float).corr(), linewidths=0.1, vmax=1.0, square = True, cmap=colormap, linecolor='white', annot=True)
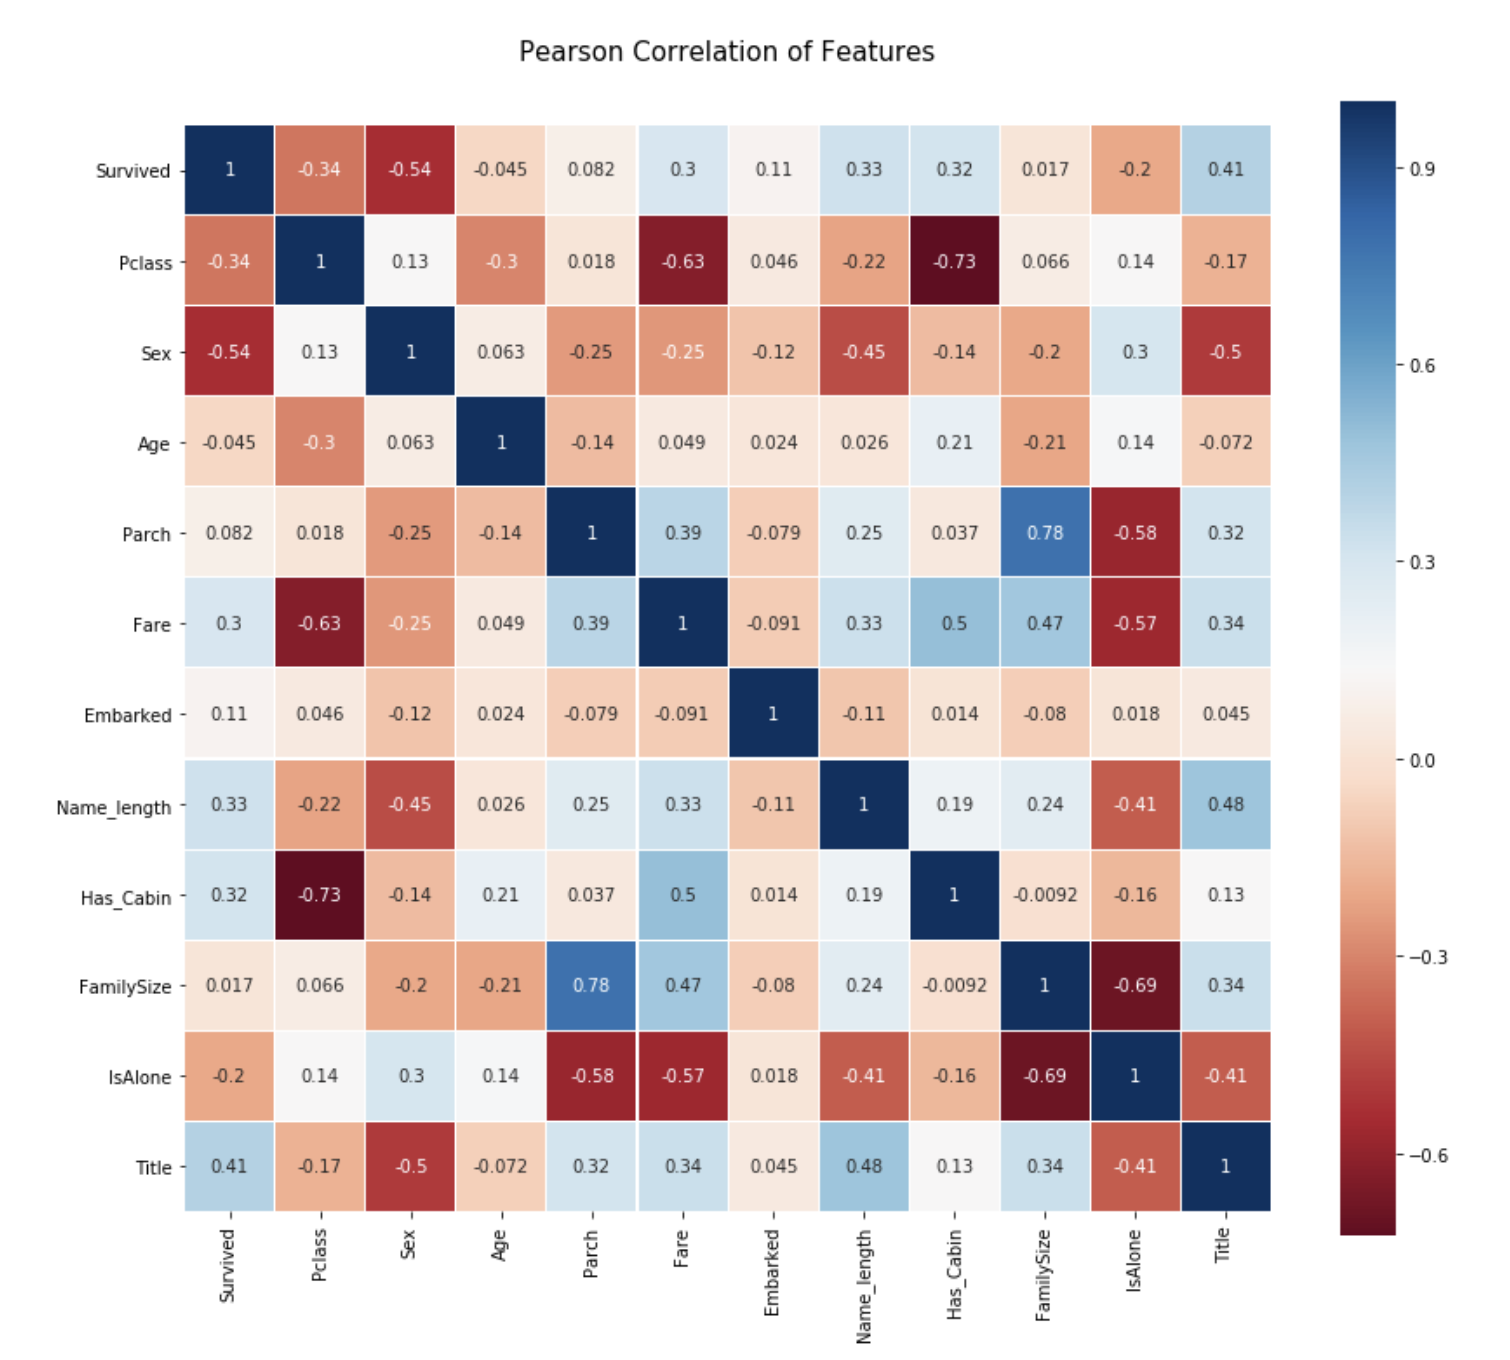
From this plot, we can see that the features are not so strongly correlated with each other.
Features are independent of each other → No useless features → Important for building a learning model (Parch and Family Size have a relatively strong correlation, but leave them as they are.)
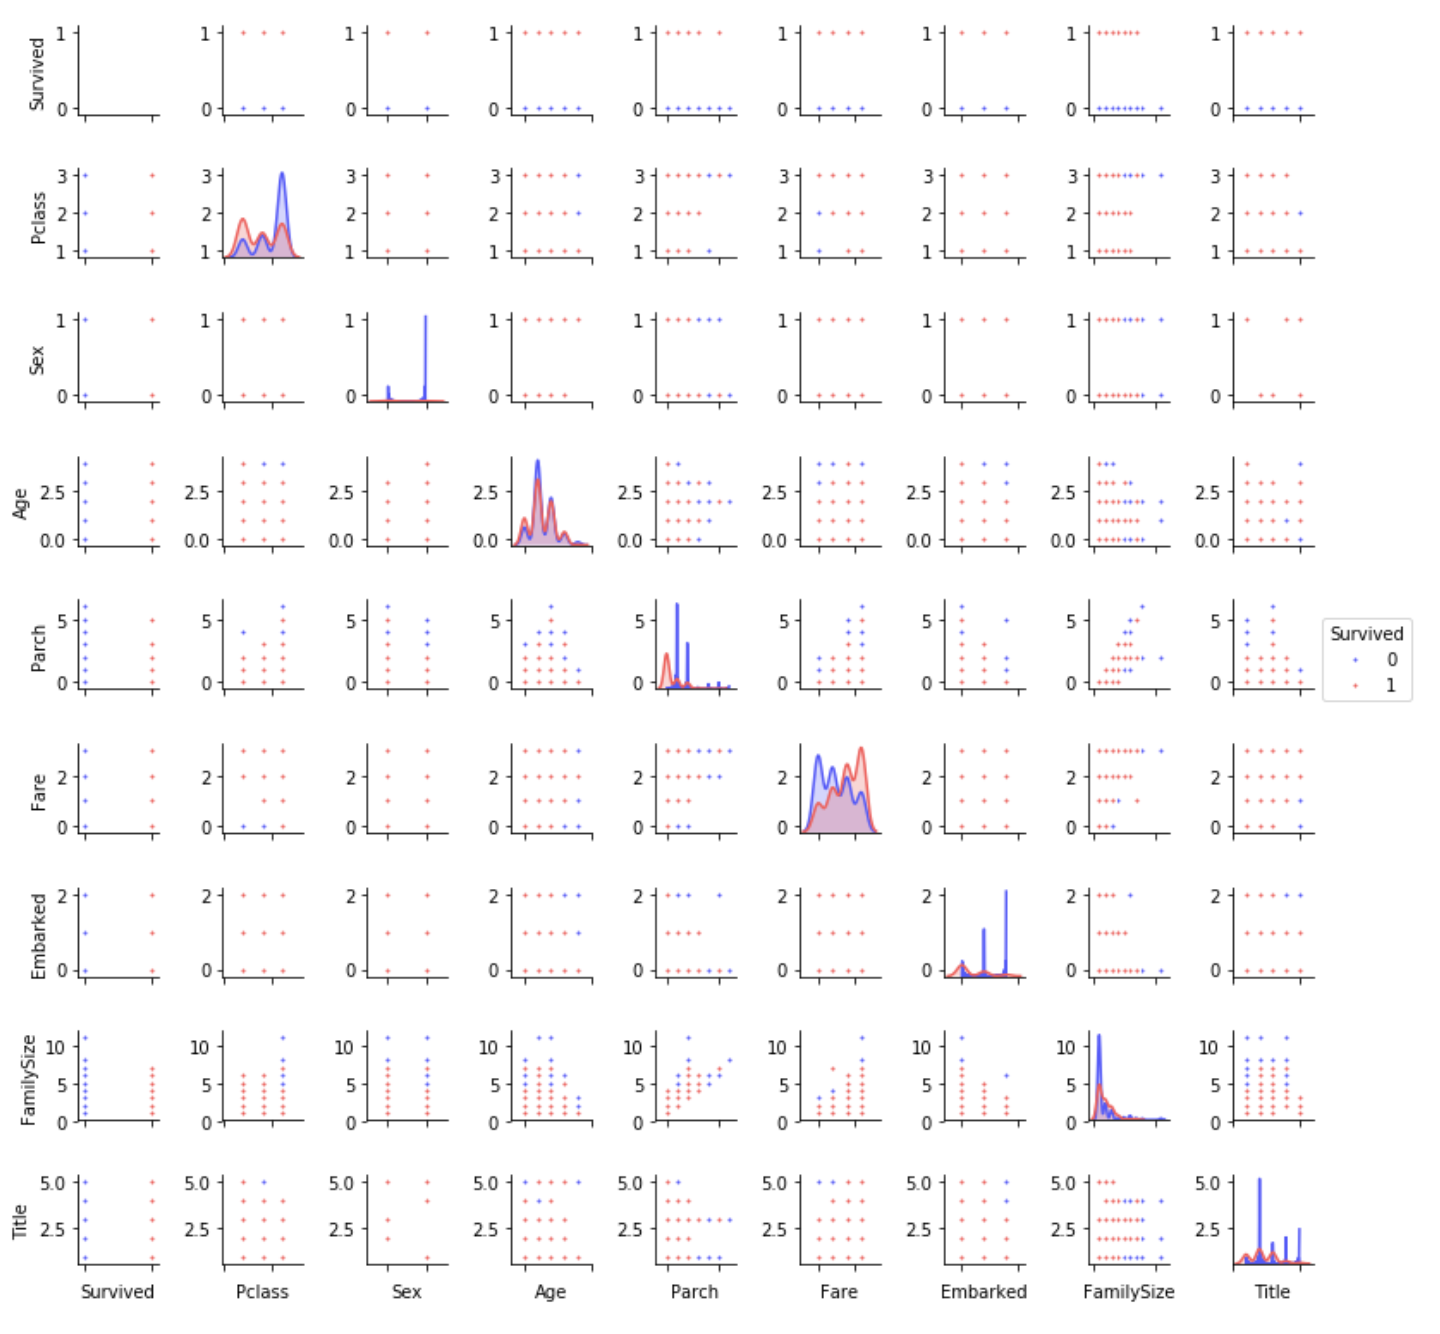
Pair Plot
Distribution of data from one feature to another
PairPlot.py
g = sns.pairplot(train[[u'Survived', u'Pclass', u'Sex', u'Age', u'Parch', u'Fare', u'Embarked',
       u'FamilySize', u'Title']], hue='Survived', palette = 'seismic',size=1.2,diag_kind = 'kde',diag_kws=dict(shade=True),plot_kws=dict(s=10) )
g.set(xticklabels=[])
Summary
In this article, I worked on Kaggle's tutorial "Titanic." As a flow,
- Import library
- Data acquisition
- Data preprocessing --Eliminate missing values (insert values close to the average value at random, etc.) --Equal division of data --Convert category data to numbers
- Data visualization --Pearson Correlation Heatmap --Pair plot
It was quite difficult so far, but I will continue to do my best because it is the actual model construction from here! !!