[PYTHON] Data analysis for improving POG 2 ~ Analysis with jupyter notebook ~
Review up to the last time
Data analysis for improving POG 1-web scraping with Python- shows the profile (gender, pedigree, stables) of horses born between 2010 and 2013. Etc.) and earned prizes during the POG period. The obtained data is saved separately for each year of birth under the file name "horse_db / horse_prof_ (yyyy) .csv".
Purpose of this time
This time, based on these data, I would like to analyze the causal relationship between the horse profile and the prize money won during the POG period, and find out the law of POG winning.
Unfortunately, I'm not a data analysis specialist. Therefore, it will be possible to draw some conclusions through trial and error. Ultimately, it is expected that multiple regression analysis and machine learning will be taken care of, but first, I would like to understand the characteristics of each factor by simple analysis.
Data analysis
This time, we will proceed with the analysis on a jupyter notebook that seems to be suitable for data analysis including trial and error. In addition, the pandas module is used to calculate statistics (mean, variance, etc.) for each factor.
Preparation
First, a data frame to be analyzed is generated.
AnalyseUmaData_160105.ipynb
import os
import pandas as pd

year_l = range(2010, 2014)
masta_df = pd.DataFrame()
for year in year_l:
    i_dname = './horse_db/'
    i_fname = 'horse_prof_%d.csv' % year
    i_fpath = os.path.join(i_dname, i_fname)
    tmp_df = pd.read_csv(i_fpath,index_col=0, header=0, encoding='utf-8')
    masta_df = pd.concat([masta_df, tmp_df])

masta_df[:10]
A part of the generated data frame is shown below.
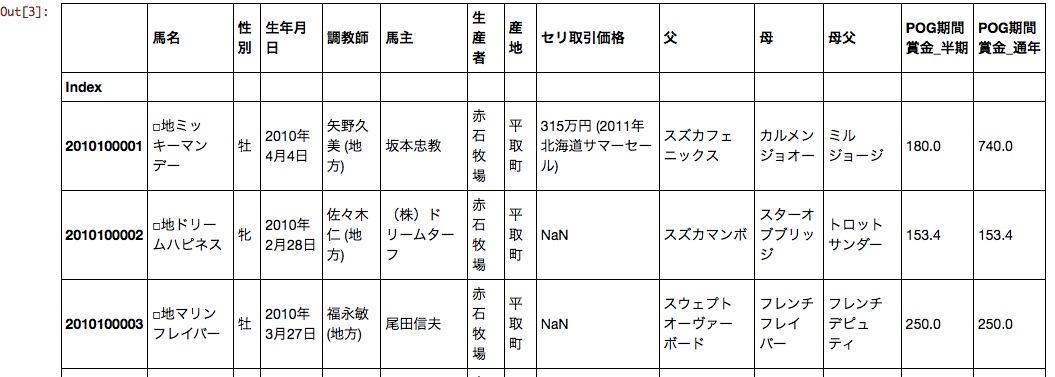
Gender, date of birth, trainer, owner, producer, auction transaction price, father, mother and father are likely to affect the POG period prize money.
As it is, the date of birth and the auction transaction price are difficult to handle, so I will mold it a little.
AnalyseUmaData_160105.ipynb
import datetime

#Birthday=>Year of birth, month of birth
birth_y = masta_df[u'Birthday'].dropna().map(lambda x: datetime.datetime.strptime(x.encode('utf-8'), '%Y year%m month%d day').strftime('%Y'))
birth_y.name = u'Year of birth'
birth_m = masta_df[u'Birthday'].dropna().map(lambda x: datetime.datetime.strptime(x.encode('utf-8'), '%Y year%m month%d day').strftime('%m'))
birth_m.name = u'Birth month'
df = pd.concat([masta_df, birth_y, birth_m], axis=1)

#Auction transaction price character string=>Quantify
df[u'Auction transaction price'] = masta_df[u'Auction transaction price'].fillna('-1')
df[u'Auction transaction price'] = df[u'Auction transaction price'].dropna().map(lambda x: x.replace(',', ''))
df[u'Auction transaction price'] = df[u'Auction transaction price'].dropna().map(lambda x: int(x.split(u'Ten thousand yen')[0]))

df[:10]
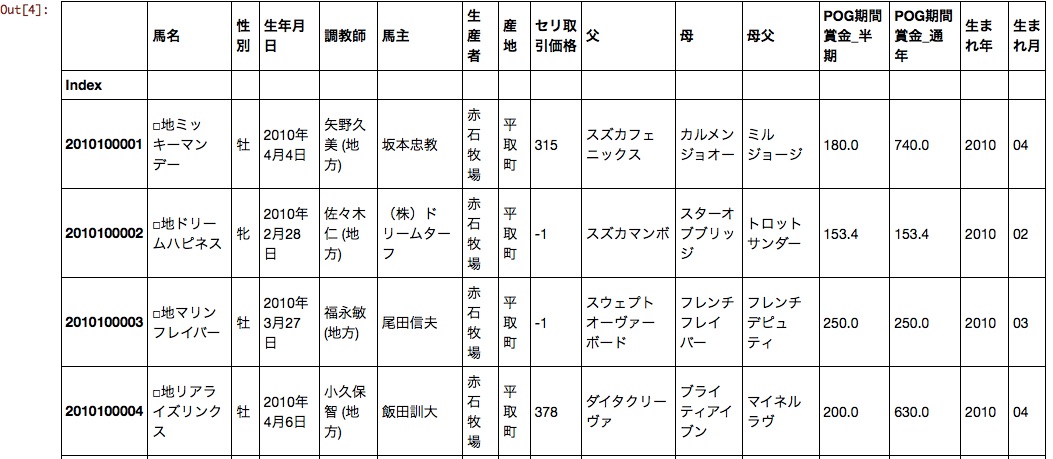
The date of birth was divided into the year of birth and the month of birth. Now the auction transaction price, year of birth, and month of birth can be handled as numerical data.
analysis
Let's start the analysis immediately. As a result of trial and error, the data aggregation script settled in the following form.
AnalyseUmaData_160105.ipynb
import numpy as np

#Explanatory variable
param_l = [u'sex', u'Birth month', u'Trainer', u'Horse owner', u'Producer', u'father', u'母father']

#Objective variable
prize_l = [u'POG period prize_half period',u'POG period prize_Year-round']

#Setting
param = param_l[0]
prize = prize_l[1]
pts_filter = 5
prize_filter = 1000 #Prize filter

#Aggregate
ser_ave = df.groupby(param).mean()[prize]
ser_ave.name = u'prize>=0_ave'
ser_std = df.groupby(param).std()[prize]
ser_std.name = u'prize>=0_std'
ser_pts = df.groupby(param).size()
ser_pts.name = u'prize>=0_pts'
ser_fave = df[df[prize]>=prize_filter].groupby(param).mean()[prize]
ser_fave.name = u'prize>=%d_ave' % prize_filter
ser_fstd = df[df[prize]>=prize_filter].groupby(param).std()[prize]
ser_fstd.name = u'prize>=%d_std' % prize_filter
ser_fpts = df[df[prize]>=prize_filter].groupby(param).size()
ser_fpts.name = u'prize>=%d_pts' % prize_filter
ser_fper = (df[df[prize]>=prize_filter].groupby(param).size()/df.groupby(param).size()).map(lambda x: float(x)*100)
ser_fper.name = u'prize>=%d_pts / prize>=0_pts [%%]' % prize_filter
result = pd.concat([ser_ave, ser_std, ser_pts, ser_fave, ser_fstd, ser_fpts, ser_fper],axis=1)
result.index.name = '%s_%s' % (param, prize)
result = np.round(result.sort_values(by=ser_fper.name, ascending=0),2)
result[result[ser_fpts.name] >= pts_filter][:10]
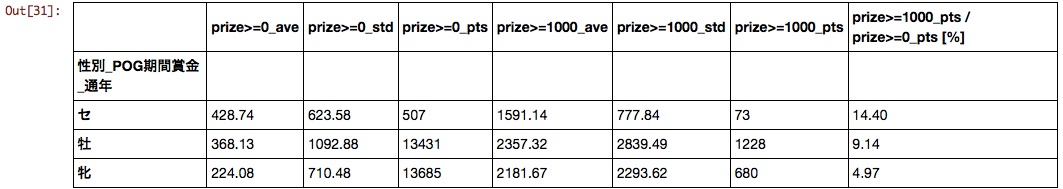
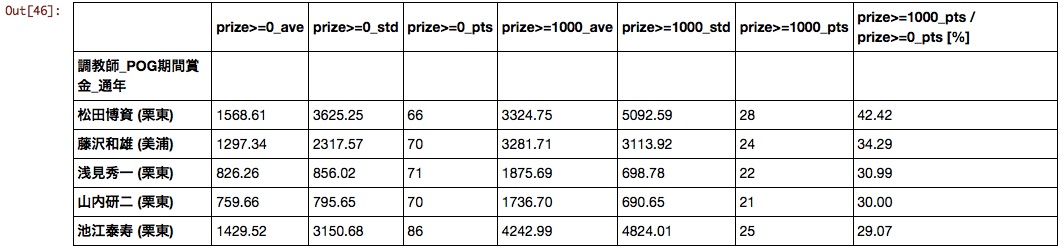
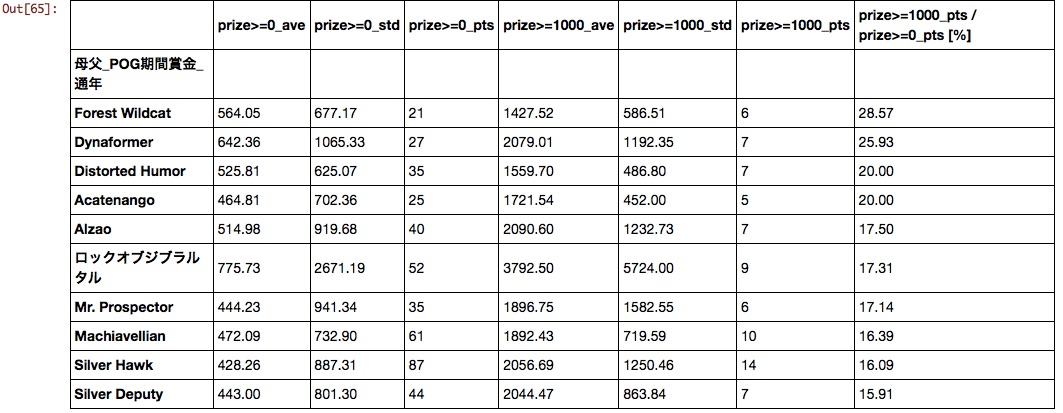
Each column has a prize of 0 or more, that is, the mean, variance, and score for all horses as a population. Mean, variance, score, when the population is a horse with a prize of 10 million or more It also shows the percentage of horses with prizes of 10 million or more.
sex
The result was a gelding advantage, but it is uncertain whether it was a gelding during the POG period. At least it turns out that mares are at a disadvantage.
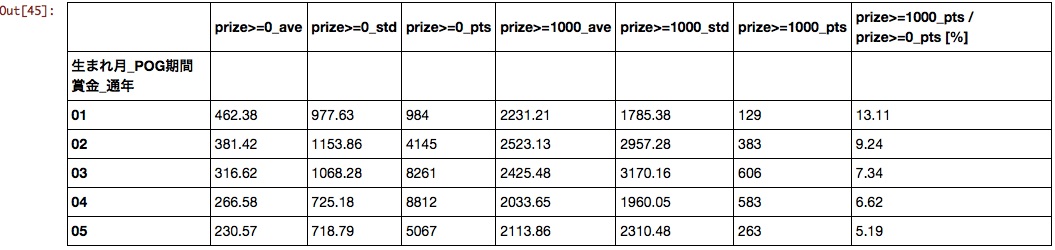
Birth month
The sooner you are born, the better.
Trainer
I feel that the ranking will change as much as possible depending on the setting of the prize filter, but when sorted at a rate of 10 million or more, the following results were obtained.
It is a pity that Matsuda Stables, which is scheduled to retire in February 2016, ranked first.
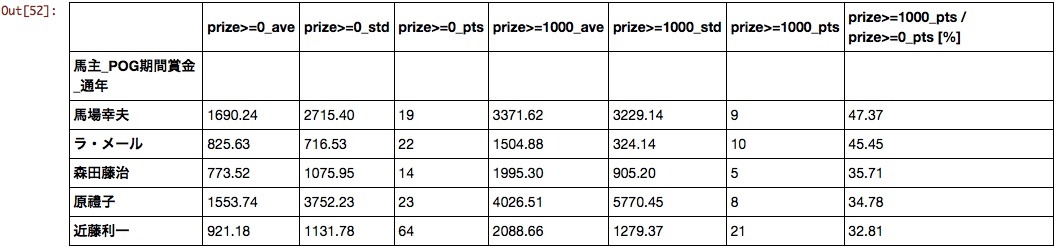
Horse owner
Surprisingly, the clubs that produce active horses in G1 have not come to the top. Is there a big difference between hit and miss for club horses?
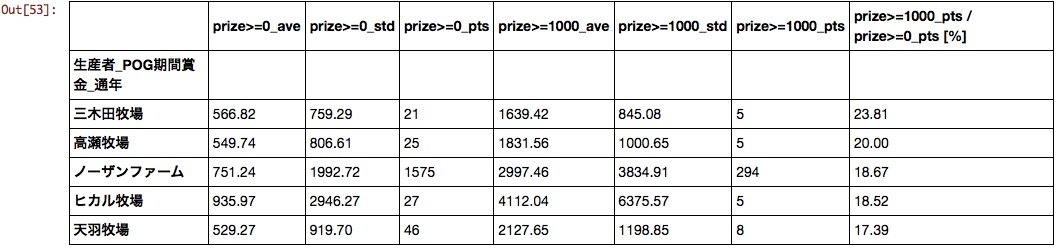
Producer
Until now, I had chosen horses with the idea of "Northern Farm for the time being if I was at a loss", but I got data that confirms that it is a reasonably reasonable idea.
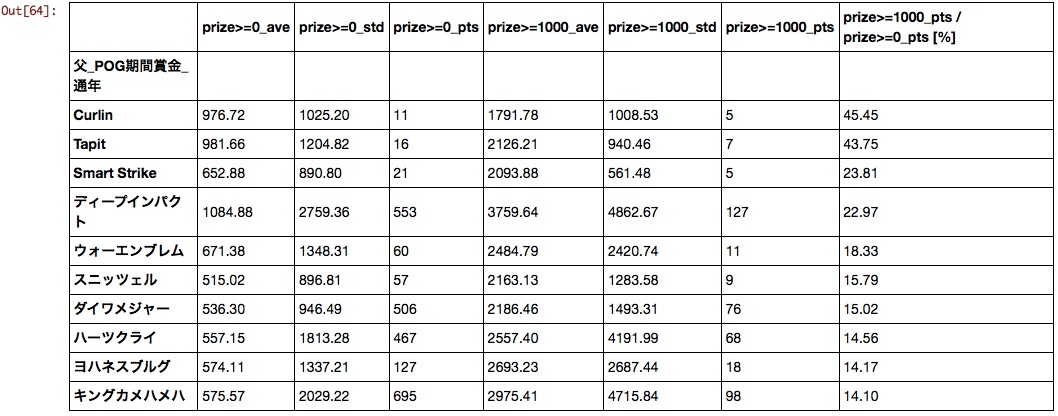
father
Unfamiliar overseas horses came to the top. Considering the population parameter and average value, it can be said that Deep, Da Major, Hearts, and King Kamehameha are for POG.
Mother father
I don't know what it is anymore. As the good results of horses born from the combination of "Stay Gold" x "Mejiro McQueen" and "Deep Impact" x "Storm Cat" have become a hot topic in recent years, it seems necessary to re-evaluate the combination of father and mother.
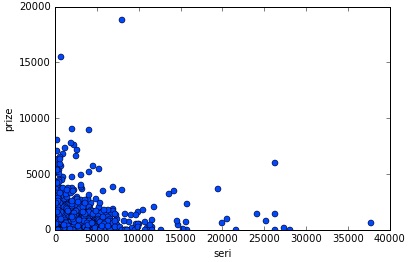
Auction transaction price
Horizontal axis: auction transaction price, vertical axis: POG period prize money scatter plot was created. It seems that there is no need to worry about the auction price in POG as no significant correlation can be found.
AnalyseUmaData_160105.ipynb
%matplotlib inline
import matplotlib.pyplot as plt

#Explanatory variable
param = u'Auction transaction price'

#Objective variable
prize_l = [u'POG period prize_half period',u'POG period prize_Year-round']
prize = prize_l[1]

#Scatter plot
x = df[df[param]>0][param]
y = df[df[param]>0][prize]
plt.plot(x, y, linestyle='None', marker='o')
plt.xlabel('seri')
plt.ylabel('prize')
plt.show()
This summary
To summarize the results obtained in this analysis, if you select a horse that is an early-born stallion and is produced by Deep Impact, Daiwa Major, Heart's Cry, or King Kamehameha and is owned by an individual owner, you can select a horse that will win with a reasonable probability. It turns out that it is.
However, in this analysis, there is still room for improvement, such as the fact that the prize threshold is set to 10 million and the effect of the combination of each factor has not been verified, so it is not possible to easily draw a conclusion. Based on this result, it seems necessary to review the analysis method itself.
from now on
Work on data visualization, multiple regression analysis, machine learning, etc.