Reading Note: An Introduction to Data Analysis with Python
This is a memo that I got caught while reading the introduction to data analysis using Python. I prefer to run in Pycharm over IPython. I am adding while reading. I'm a beginner in programming, and I'm stuck in various places, so I'm writing it as a reference for those who will learn it later and as a reference when I forget it.
environment ・ Windows 10 (64bits) ・ Python3.5 (Anaconda) ・ Pandas 0.18.1 ・ Data analysis by Python, 1st edition, 2nd edition reference ・ English version of errata * O'Reilly Japan should translate and publish it, but O'Reilly Japan So you will never do it. ・ 2016/06/11 I noticed that https://github.com/wesm/pydata-book Isn't it best to use it?
Chapter 2
P.22, 23 usa.gov Data appearance top time zone
Whether you run it in IPython or in an integrated development environment,
import matplotlib.pyplot as plt
import pandas as pd
Implemented. plt and pd are personal freedoms, but there is a convention that they are plt and pd. numpy is np.
When displaying a graph in an integrated development environment
var=tz_counts[:10].plot(kind="barh", rot=0)
plt.show(var)
I wrote that and it worked.
Separately
tz_counts[:10].plot(kind="barh", rot=0)
plt.show()
But it seems okay. If you plot with multiple data and then plt.show (), multiple graphs will be displayed at the same time.
Use subplots to display multiple graphs side by side. If it is a book, it will appear on page 45. For more information on matplotlib, see here.
P.37 pivot_table In pivot_table, rows and cols appear, but as of May 28, 2016, an error (TypeError: pivot_table () got an unexpected keyword argument'rows') occurs. According to here ・ Rows to index, ・ Cols to columns, It can be avoided by changing it. It actually solves it in my environment. Similar editing is required where pivot_table appears after P.37 (P.44 and P.49).
- As stated in the answer near the end of here, it was changed to use index and columns around last year. State.
p.39 description of get_top1000
As of 06/04/2016, Warning will be issued asking you to change group.sort_index to group.sort_values. I changed it to values quietly.
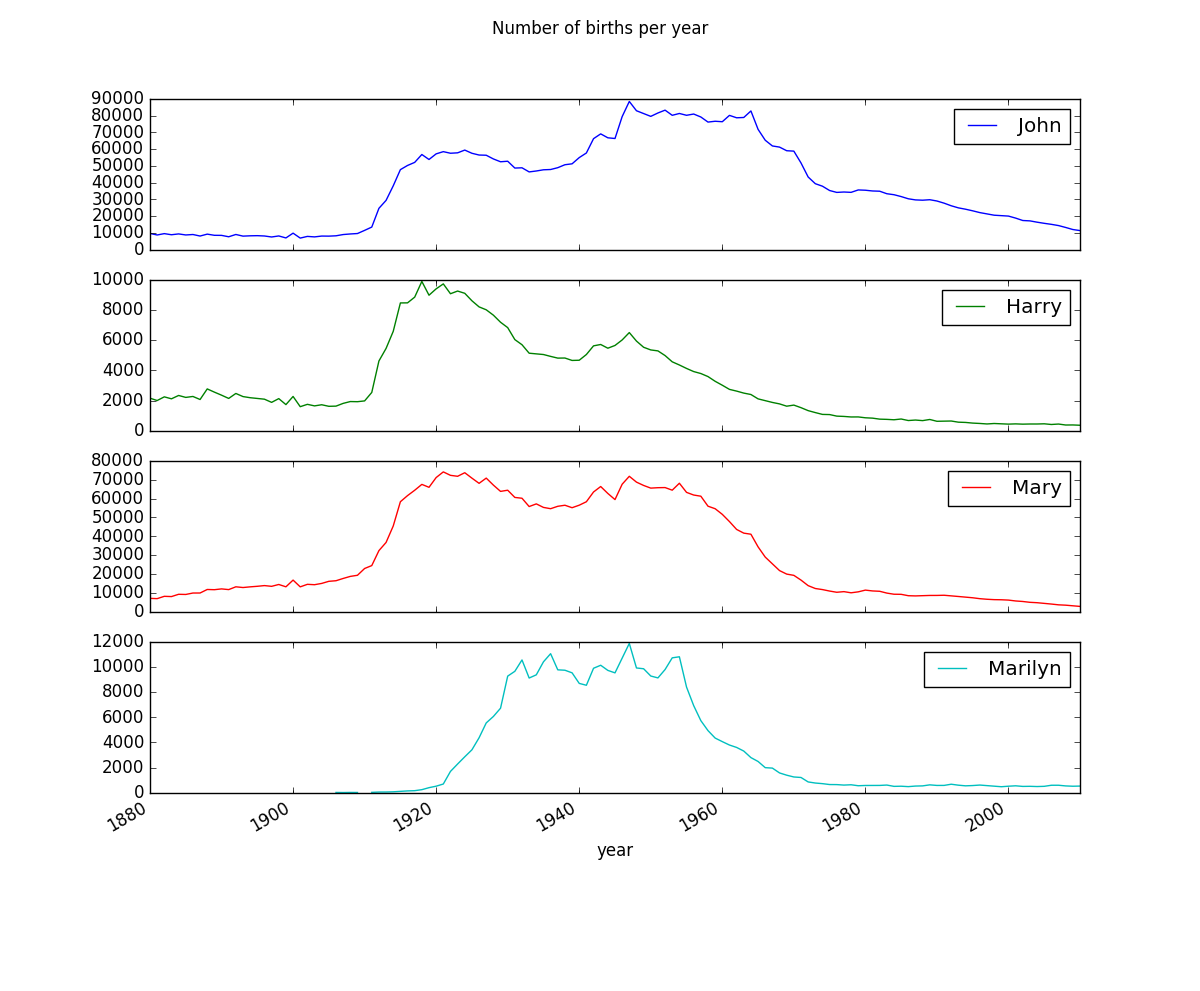
P.40 Name graph drawing
I'm using Pycharm instead of IPython, but as in the book, where I make a subset and plot it, according to the book,
subset = total_births[['John', 'Harry', 'Mary', 'Marilyn']]
var = subset.plot(subplots=True, figsize=(12, 10), grid=False, title = "Number of births per year")
plt.show(var)
Then, ValueError: The truth value of an array with more than one element is ambiguous. Use a.any () or a.all () is displayed. There must be a good reason why this is displayed, but at present, I don't understand.
For the time being, by changing plt.show (var) to plt.show (var.all ()), I was able to draw a graph that looks the same as a book.
When I updated the package individually on 2016/06/03 to display this graph and re-executed it, an error occurred. So, as it is downgraded when running conda update --all
・ Hdf5 1.8.16-> 1.8.15.1
・ Numexpr 2.6.0-> 2.5.2
・ Numpy 1.11.0-> 1.10.4
After that, I was able to display the graph again. Apparently, it's okay to update numpy and numexpr separately, but if you set numpy to 1.11.0 and then numexpr to 2.6.0, SyntaxError: (unicode error)'unicodeescape' codec can't decode bytes in position 2-3: An error appears as truncated \ UXXXXXXXX escape, so there seems to be something wrong with this combination.
P.41 Figure 2-6 Drawing of Sum of table1000.prop by year and sex
Since np.linspace (0, 1.2, 13) is described, it is necessary to ʻimport numpy as np`.
Also, it seems that the tendency of the ratio to decrease is more remarkable when drawing the top 100 than when drawing the top 1000.
For the time being, import is
import matplotlib.pyplot as plt
import pandas as pd
import numpy as np
Is it a good feeling to keep it?
P.43 get_quantile_count() Due to changes in API specifications, it is necessary to describe as follows.
def get_quantile_count(group, q=0.5):
    group = group.sort_values(by='prop', ascending=False)
    return group.prop.cumsum().values.searchsorted(q) + 1
Group.prop.cumsum (). values.searchsorted (q) is the changed part.
Chapter 3
Around P.52 randn ()
When executing other than IPython such as Pycharm, import
import numpy as np
import pandas as pb
import matplotlib.pyplot as plt
Then, randn () is described as np.random.randn (). On P.61, np.random.randn () is used, so it may need to be modified here. It is also described in the errata on the English site.
- In the Jupyter notebook that can be downloaded from github, import is imported numpy.random as randn. It's a bit confusing because the notation isn't unified, but I wonder if this book isn't about learning Python itself.
P.58 IPython HTML Notebook
Now it's called Jupyter.
P.59 Using IPython from editor and IDE
Pycharm also allows you to create and run Jupyter notebooks. It can be created in the same way as a .py file. I haven't found any meaning in Pycharm so far. Is there any useful function? As of 06/04/2016, you can't see the result of % magic or% reset? Even if you execute it from Pycharm.
In the case of Pycharm, the paid version (Professional Edition) is required to calculate the processing speed.
Chapter 4
P.90 data Since data appears suddenly,
data = np.random.randn(2, 3)
I interpreted it as, and confirmed the process of multiplying it by 10 and adding it. Needless to say, since it is running in Pycharm,
def main():
    data = np.random.randn(2, 3)
    print('data is\n', data)
    print('data*10 is\n', data * 10)
    print('data+data is\n', data + data)


if __name__ == '__main__':
    main()
It is described as. It may be easier to use IPython obediently here.
P.95 Definition of numeric_strings
There is numeric_strings = np.array (['1.25','-9.6', '42'], dtype = np.string_), but numeric_strings = np.array (['1.25','-9.6','-9.6', '42']) Isn't it useless?
I'm not sure why I dare to specify it here. The result of numeric_strings.dtype will change.
P.99 Three-dimensional array
I got stuck in ʻarr3d [0] being a 2x3 matrix. Considering the x direction (row) y (column) z direction, I understood when I thought that ʻarr3d [z] [x] [y] = arr3d [z, x, y] . The result of np.shape (arr3d) could also be understood by interpreting it as (z, row, column).
Isn't it natural that the order is not x, y, z? Is it natural to speak another language? I'm confused because it's the first time I've taken 3D arrays seriously in Python.
P.101 Definition of names
As described in the book
names = np.array(['Bob','Joe', 'Will', "Bob", "Will", "Joe", "Joe"], dtype='|S4')
Then it doesn't work. In the first place, I don't understand what I'm doing.
For the time being,
names = np.array(['Bob','Joe', 'Will', "Bob", "Will", "Joe", "Joe"])
It works normally, so I'll do it. There is a proper translation in the definition of data. I'm not sure why it's here and there's nothing else.
P.106 arr = np.arange(16).reshape((2,2,4)) 2 = z direction 2 = x direction = row 4 = y direction = column I could understand it.
ʻArr.transpose ((1,0,2)changes what was originally in the order of 0,1,2 to 1,0,2, that is, if you think of it as the exchange of the z-axis and the x-axis, The view of ʻarr.transpose (1,0,2)is
array([[[ 0,  1,  2,  3],
        [ 8,  9, 10, 11]],

       [[ 4,  5,  6,  7],
        [12, 13, 14, 15]]])
I understand that.
p.107 swapaxes ʻArr.swapaxes (1,2)` can be understood by thinking that z-axis = 0, x-axis = 1, y-axis = 2 and that x-axis and y-axis are interchanged.
It is strange that ʻarr.swapaxes (2,1) is not the same, and considering that arr is 2x2x3, for example, ʻarr.swapaxes (2,3) would be an error, ʻarr.swapaxes I thought that (2,2) `doesn't change anything, but it shouldn't cause an error, and when I tried it, it was, so I couldn't confirm it somewhere. I did.
P.108 randn
I encountered it on the previous page, and there was a translation in the previous appearance, so I think that there is no problem, but
ʻIf you are importing numpy as np, you will get an error if you do not write np.random.randn (8) `.
P.111 Diagram of possible values of the function sqrt (x ^ 2 + y ^ 2)
At first, I was planning to run it in Pycharm, but it became more and more troublesome, and I got stuck because I was running it in IPython (Juypter Notebook).
I was worried that the graph would not be displayed even if I entered it according to the book, but I was just worried.
All I had to do was plt.show ().
However, I thought that the graph would be displayed inline like mathematica, so the behavior was unexpected (⇒ If you enter% matplotlib inline, it will be displayed inline). Also, it's a little surprising to be able to insert formulas in TeX format in the title of the graph.
After all, it looks like this to display well on Jupyter Notebook.
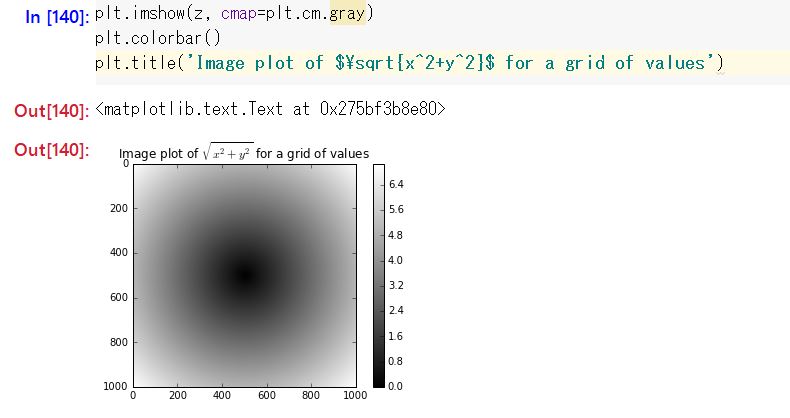
Also, the gray graph is not interesting, so I tried to do plt.imshow (z, cmap = plt.cm.magma). If you enter an unacceptable color specification, a list of acceptable color specifications will be displayed, so I tried to enter it appropriately with reference to it.
P.112 np.where There is a typographical error with np.whare.
P.116 Sort
The initial value of the axis of the sort function is -1. From Official Documents. Therefore, in the case of a two-dimensional array, the column direction is sorted when nothing is specified.
P.121 mat.dot(inv(mat))
The execution result of mat.dot (inv (mat)) does not match the book.
At first, I thought that mat.dot (inv (mat)). Astype (np.float32) could be used to convert the data type of the NumPy array, but it didn't seem like that, so I multiplied it by 1000. Rounded to an integer (rint) and then divided by 1000. Please tell me the correct way.
np.rint(mat.dot(inv(mat)) *1000) /1000

array([[ 1.,  0.,  0.,  0., -0.],
       [ 0.,  1.,  0., -0., -0.],
       [ 0.,  0.,  1.,  0.,  0.],
       [ 0.,  0., -0.,  1.,  0.],
       [-0., -0.,  0., -0.,  1.]])
P.121 Matrix multiplication
In the comment of the book, there is a description that the notation is other than np.dot, but now it seems to be @.
So, I think you can calculate with X.T @ X.
P.126 crossing_times = (np.abs(walks[hit30])>=30).argmax(1)
crossing_times = (np.abs (walks [hit30])> = 30) .argmax (1), for example, crossing_times = (np.abs (walks [hit30])). Argmax (1) , Or crossing_times = walks [hit30] .argmax (1) I wondered if it wasn't good, but
・ Absolute value is 30 or more
・ I want the first index of 30 or more, not the index with the maximum distance.
So it's the content of the book, isn't it?
I think the point of understanding is that "in the case of an array of boolean values, the index that is True at the very beginning is returned" on page 124.
Chapter 5
Result of P.128 obj.index
In the case of books, it is Int64Index ([0, 1, 2, 3]), but when I try it at hand,
RangeIndex(start=0, stop=4, step=1)
Will be.
P.129 np.exp(obj2) Does the result of index = d look strange? It's about 54.6, right?
P.134 Extraction of rows and extraction of columns
frame2.ix ['three'] is the row retrieval, and when fetching the row, use ix,
If you are not using ix, like frame2 ['debt'], it will be a column retrieval,
About, what you should remember.
P.141 ffill, bfill ffill = fill in the front bfill = fill in the back It is written that it is in English, Fill values forward, Fill values backward, so it may have happened, but it seems to be misunderstood.
It seems that the English dictionary can be interpreted as "look ahead (verb)" with verb + forward, so it is easier to remember expressions such as filling in the holes using the front and filling in the holes using the back if it is bfill. Search forward is also interpreted as searching while looking forward, isn't it?
P.144, 145 When using slicing for DataFrame
When slicing is used, such as ʻobj ['b':'c'] , it is applied to the line. The same applies to index value reference data [: 2]`.
If you just say data ['two'], it works on columns. When it comes to slicing, it acts on the index. I'm a little confused.
Other things I checked while touching the Jupyter Notebook.
· Data [: 3] is equal to data.ix [: 3].
-If you want to use slicing in the columns direction, use data.ix [:,: 3]. This is considered to be one of the expressions of ʻobj.ix [:, val]` to extract columns as shown in Table 5-6.
P.154 obj.order() order now seems to be deprecated. A message was displayed to use sort_values (). Will it be an error in the future?
P.155 frame.sort_index(by='b')
This also seems to be deprecated now. Certainly confusing. From python
frame.sort_values (by ='b') is recommended.
p.155 frame.sort_index(by=['a', 'b']) You will be asked to sort_values here as well. This means that after sorting in column a, the same value is sorted in column b. I want a little more explanation in the book.
P.158 df.sum(axis=1) The addition of only np.nan is written in the book so that it becomes np.nan, but as far as I try it as of 06/07/2016, it becomes 0.0. The behavior is the same when skipna = False. Will it be 0 when there is nothing to add? However, when I check the latest manual of pandas, it says "Exclude NA / null values. If an entire row / column is NA, the result will be NA", so is it a bug?
P.159 Result of df.describe ()
In the book, all the items have numbers, but if you try it at hand,
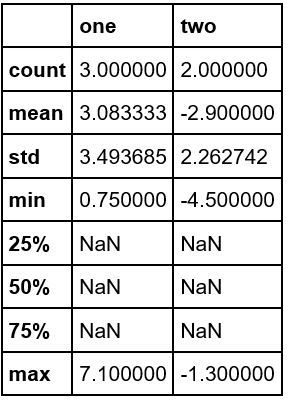 is. Did the specifications change at some point? Even if you look at the Manual, I'm not sure.
pp.160 import pandas.io.data as web When you do this,
The pandas.io.data module is moved to a separate package (pandas-datareader) and will be removed from pandas in a future version.
It will be displayed. So, for the time being, I did conda install pandas-datareader.
import is
import pandas.io.data as web
To
import pandas_datareader.data as web
As it worked. In the manual, I wrote ʻimport pandas_datareader as pdr so that it works even if pdr.get_data_yahoo` is done, but it seems different.
all_data.iteritems() The description here seems to be based on Python2 series. In Python3, the specification of (dict) .items has been changed, so the description around here is
price = DataFrame({tic : data['Adj Close']
                  for tic, data in all_data.items()})
volume = DataFrame({tic: data['Volume']
                             for tic, data in all_data.items()})
It looks good. Maybe the answer is here http://stackoverflow.com/questions/13998492/iteritems-in-python It seems to be included in, but I don't understand English very well.
P.162 Definition of obj
Because it is troublesome to imitate and input
obj=Series(list('cadaabbcc'))
I want you to write.
P.163 pd.value_counts(obj.values)
Since it counts value, I wonder if I should just write pd.value_counts (obj). No error.
P.167 .dropna(thresh=3) I was a little confused by the idea of the threshold, but it means that the value is set to a number other than NaN. When I often read P.166, it certainly says so. On the contrary, I was a little confused because I thought it was the number of NaN. By the way, it would be better to understand the operation of df.dropna (thresh = 3) by setting it to 2.
P.167 df.fillna({1:0.5, 3:-1}) This isn't in column 3, but what are you doing? 2 mistakes?
P.168 df.fillna(0,inplace=True)
It says _ = df.fillna (0, replace = True), but is _ = an editing mistake? You don't need it.
P.169 Definition of data
It's a hassle to type'a','a' ...
data = Series(np.random.randn(10),index=[list('aaabbbccdd'),[1,2,3,1,2,3,1,2,2,3]])
I want you to make a sample.
Results of P.170 data.index
At hand
MultiIndex(levels=[['a', 'b', 'c', 'd'], [1, 2, 3]],
           labels=[[0, 0, 0, 1, 1, 1, 2, 2, 3, 3], [0, 1, 2, 0, 1, 2, 0, 1, 1, 2]])
became. Is it a slight specification change?
P.172 MultiIndex It depends on import, but if you import as described in this book,
pd.MultiIndex.from_arrays([['Ohio','Ohio','Colorado'],['Green','Red','Green']],
                      names=['state','color'])
So, if you don't write pd, it's useless. I wonder if I didn't check the contents when translating this.
P.176 pdata.swapaxes('items', 'minor') The result just before this is
<class 'pandas.core.panel.Panel'>
Dimensions: 4 (items) x 868 (major_axis) x 6 (minor_axis)
Items axis: AAPL to MSMT
Major_axis axis: 2009-01-02 00:00:00 to 2012-06-01 00:00:00
Minor_axis axis: Open to Adj Close
So I tried pdata = pdata.swapaxes ('items','minor_axis'), but it seems that it doesn't matter whether _axis is present or not. In either case, no error occurs.
Even in the previous part, import is
import pandas_datareader.data as web
is.
Chapter 6
read_csv(), read_table() Although read_csv () and read_table () are written separately, it is possible to read a file by specifying sep = in the same way for read_csv and read_table.
P.186 tot.order() tot.sort_values () is recommended.
P.186 tot.add(piece['key'].value_counts(), fill_value=0)
for piece in chunker:
    tot = tot.add(piece['key'].value_counts(), fill_value=0)
However, reading the Series add manual will deepen your understanding. http://pandas.pydata.org/pandas-docs/stable/generated/pandas.Series.add.html
If fill_values = 0 and NA value is not processed, the result of addition of Series including NA will be NA, and .add is used for the purpose of preventing the aggregation result from being full of NA.
P.187 sys.stdout
Beforehand,
import sys
If you don't, it won't pass. Isn't this written on the assumption that you are familiar with the Python language?
P.188 data.to_csv(sys.stdout, index=False, cols=['a','b','c'])
manual
http://pandas.pydata.org/pandas-docs/version/0.18.1/generated/pandas.DataFrame.to_csv.html
As in
data.to_csv(sys.stdout, index=False, columns=['a','b','c'])
If you do not set it to, it will not work.
One thing I'm curious about is that when you say cols, you don't get an error, you just pick up and write out columns other than the one you want. Should I get an error? bug?
Contents of P.188 tseries.csv
In the environment at hand, unlike the results of the book, there is no time information,
.csv
2000-01-01,0
2000-01-02,1
2000-01-03,2
2000-01-04,3
2000-01-05,4
2000-01-06,5
2000-01-07,6
have become.
P.189 print line In Python3, it's print (line).
P.192 to_json, from_json There is a statement that there are attempts to implement to_json and from_json. According to the manual, to_json seems to be implemented as of June 08, 2016. Since from_json is not described in the manual, it may not be implemented yet.
P.192 urlib2
It seems that the packages are integrated in Python3 and only urllib is available.
Also, you can't just modify it to from urllib import urlopen, you have to do it with from urllib.request import urlopen. This is also affected by the change from Python 2 to 3.
Reference: http://diveintopython3-ja.rdy.jp/porting-code-to-python-3-with-2to3.html
- The effect of the difference between Python 2 and 3 here is that after using a program that automatically converts the source, the difference should be evaluated and published as an errata.
P.198 Reading binary data (Pickle data?)
pd.load()
However, in the latest pandas,
pd.read_pickle('ch06/frame_pickle')
It has become.
Reference: http://pandas.pydata.org/pandas-docs/stable/io.html#io-pickle
Chapter 7
P.206 Pd.merge(df1, df2) When I try it at hand, the order of the results is slightly different from what is described in the book. In the book, the order is as if it were sorted by key, but at hand, the result is that it is sorted by df1 (data1).
P.208 Cartesian product
It's like a Cartesian product. I heard it for the first time.
Reference: https://ja.wikipedia.org/wiki/%E7%9B%B4%E7%A9%8D%E9%9B%86%E5%90%88
Recommended Posts