Muscle jerk analysis with Python

(from pixabay)
Muscle training enthusiasts who are said to have 114514 people in the IT industry
Hello, this is alf ++.
Today I'm going to talk about muscles, especially the jerks. Of course, the code is written in Python. Now let's talk about muscles.
IT engineer and muscle
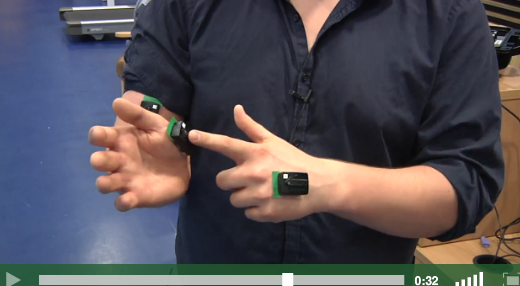
IT engineers love muscle training very much. However, few people try to support muscle training with IT, I am very sad. Therefore, in this article, we will support muscle training with IT. First, I will introduce an EMG sensor that can quantify the strength and timing of muscle jerks and its analysis method.
Digitization by muscle jerks and myoelectric sensors
Why is the muscle tingling?
Muscles receive motor commands from the human brain in the form of electrical signals.
The muscles contract strongly according to the strength of this electrical signal. On the contrary, when there is no electric signal, it relaxes. [^ 1]
Therefore, muscle jerks can be quantified by looking at the electrical signals transmitted to the muscles.

Fortunately, the electrical signals transmitted to the muscles leak from the muscles to the surface of the skin, so
By measuring this leaked signal, you can quantify the jerks of your muscles.
A measuring instrument that applies this phenomenon is called an "electromyographic sensor [^ 2]".
 (Quoted from Delsys' HP [1])
Visualize muscle jerks with Python
Let's see how the thighs are tingling when actually walking from the value of the myoelectric sensor. First, download the EMG sensor dataset from the following site. http://archive.ics.uci.edu/ml/datasets/EMG+dataset+in+Lower+Limb
In this, visualize 1Nmar.log. The code to visualize is below.
VisulizeEMG.py
import matplotlib.pyplot as plt
import pandas

FILE_PATH="../SEMG_DB1/N_TXT/1Nmar.txt"
HEADER_SIZE=6

data=pandas.read_csv(FILE_PATH,skiprows=HEADER_SIZE,sep="\t")
data.columns=["RF","BF","VM","ST","FX"]

plt.plot(data["RF"])
plt.xlabel("Time[ms]")
plt.ylabel("EMG[V]")
plt.show()
The result of the execution is as follows.

The above figure is called an electromyogram. Rather than turning it on and off like a switch, It looks like a voice-like wave. Actually, the signal transmitted to the muscle is alternating current instead of direct current. Therefore, it is necessary to process the sensor data a little to see how it feels.
Calculate muscle jerk strength and timing with Python
When looking at the strength of an AC signal, the root mean square (RMS) is often used as an index. Therefore, the index of muscle jerkiness is calculated here using the root mean square. The code is below. Note that this code is different from the normal root mean square, The point is that it uses the moving average root mean square.
VisualizeStrength.py
import matplotlib.pyplot as plt
import pandas

import numpy as np

WINDOW_SIZE=200

#http://stackoverflow.com/questions/8245687/
# numpy-root-mean-squared-rms-smoothing-of-a-signal
#Modified based on
def window_rms(a, window_size):
  a2 = np.power(a,2)
  window = np.ones(window_size)/float(window_size)
  return np.sqrt(np.convolve(a2, window,"same"))

FILE_PATH="../SEMG_DB1/N_TXT/1Nmar.txt"
HEADER_SIZE=6

data=pandas.read_csv(FILE_PATH,skiprows=HEADER_SIZE,sep="\t")
data.columns=["RF","BF","VM","ST","FX"]

RMS=window_rms(data["RF"],WINDOW_SIZE)

plt.plot(data["RF"],color="lightgray")
plt.plot(RMS)
plt.xlabel("Time[ms]")
plt.ylabel("EMG[V]")
plt.show()
So, when you actually execute it, the following figure will appear.

The larger the blue line, the tighter it is. Because it is jerks at regular intervals You can see how the muscles look when you are walking.
An example of applying muscle jerks to IT
Applying this analysis, for example, depending on the activity of jerks
You will be able to operate the drone and so on.
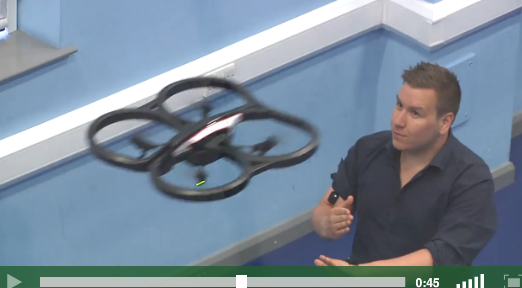 (Quoted from Delsys' HP [2])
In this study, to perform rehabilitation as a game
It seems that it is being developed.
Also in 2016, the first year of VR
It seems that it is also used as a controller to operate the arm of the character in the VR space.
 (Click to go to the demo video on YouTube.)
In this way, muscles have endless possibilities.
Summary
IT engineers love muscle training very much. However, few people try to support muscle training with IT, I am very sad. Therefore, in this article, we will discuss the strength and timing of muscle jerks so that muscle training can be supported by IT. I introduced a myoelectric sensor that can be quantified and a rudimentary analysis method using Python. Analysis by Python can be applied to user interfaces and rehabilitation. However, it seems that there are very few examples of applying it to muscle training. In the future, IT engineers will use EMG sensors to create applications that improve muscle training. I sincerely hope that you will develop it.
__ If you write so far, don't tell me to make it __
References
[1] http://www.delsys.com/products/wireless-emg/trigno-lab/ [2] http://www.delsys.com/education/videos/research/serious-games/
[^ 1]: Of course, an electrical signal may be emitted from the spinal cord called the spinal reflex. Details are likely to be around Kandel Neuroscience. [^ 2]: Strictly speaking, it is called a surface EMG (sEMG) sensor.
Recommended Posts