[Python] Get economic data with DataReader
The following chart was introduced on twitter.
 This chart is
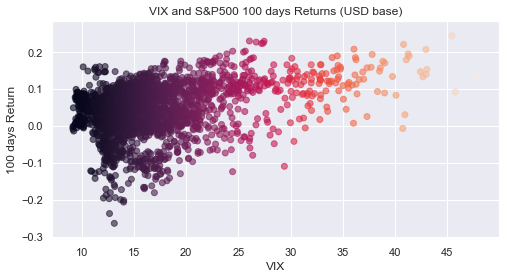
The horizontal axis is VIX (VIX), and the vertical axis is the rate of increase / decrease for 100 days (about half a year). There is a positive correlation between the VIX level and the subsequent rate of increase / decrease, not a random walk. Since the current VIX is about 40, it seems unlikely that the return after half a year will be negative from the past cases (investment is at your own risk!)
It means that.
This chart was created using Python's pandas_datareader to obtain the VIX (Fed Index) and S & P 500 Index from the Federal Reserve Bank of St. Louis website.
Save the code here.
First, load the library.
python
import pandas as pd
import numpy as np
import pandas_datareader.data as web

import datetime
import matplotlib.pyplot as plt
import seaborn as sns
sns.set()
from pandas.plotting import register_matplotlib_converters
register_matplotlib_converters()
1. Get data with DataReader
python
#Specify the start date and last date of the data to be acquired
start = datetime.datetime(2010, 1, 1)
end = datetime.datetime(2020, 5, 1)


#S&Get P500 data
# 'SP500'Is S&P500 ticker symbol.
# 'fred'However, it specifies the Federal Reserve Bank of St. Louis as the data source.
#The rest is the start date and the last day.
eq = web.DataReader('SP500', 'fred', start, end)

#Get VIX data
# 'VIXCLS'Is the VIX ticker symbol.
vix = web.DataReader('VIXCLS','fred', start, end)

#Combine the acquired data into one data frame
df = pd.DataFrame(index = eq.index)
df['Equity'] = eq
df['VIX'] = vix
df.dropna(inplace = True)
You can get various economic and financial data from the Federal Reserve Bank of St. Louis. St. Louis Federal Reserve Bank of St. Louis Website The symbol ticker is at the very end of the URL of each data.
Example: In the case of VIX, it will be VIXCLS at the end of the following address.
https://fred.stlouisfed.org/series/VIXCLS
2. Create a graph
python
#Function to make a graph
def chart(days):
    dfd = df.copy()
    dfd['Return'] = (dfd['Equity'].shift(-days) /  dfd['Equity'] -1)
    dfd.dropna(inplace = True)
    plt.figure(figsize = (8,4))
    plt.scatter(x = dfd['VIX'], y = dfd['Return'], alpha = 0.6, c = dfd['VIX'])
    plt.xlabel('VIX')
    plt.ylabel(str(days)+' days Return')
    plt.title('VIX and S&P500 '+str(days)+' days Returns (USD base)')
    plt.savefig('VIX_SP500rtn',bbox_inches="tight")

#Execute function by specifying how many days of return to calculate
chart(100)
↓ This graph is made.

plt.scatter(x = dfd['VIX'], y = dfd['Return'], alpha = 0.6, c = dfd['VIX'])
↑ By c = dfd ['VIX'] of this code, the color of the points in the graph is changed according to the value of VIX to create a gradation effect.
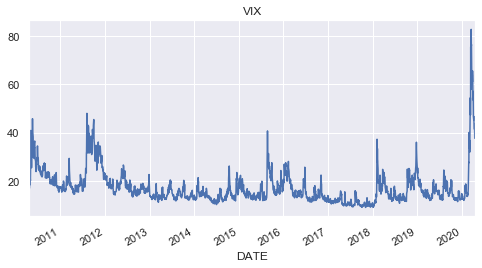
Bonus 1: VIX chart
python
df['VIX'].plot(title = 'VIX', figsize = (8,4))
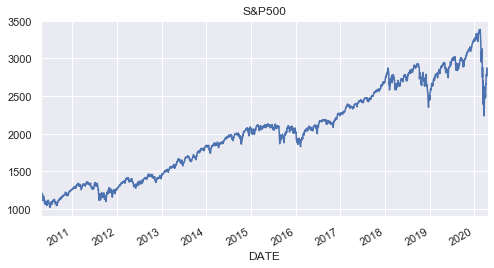
Bonus 2: SP500 Chart
python
df['Equity'].plot(title = 'S&P500', figsize = (8,4))
in conclusion
With DataReader, you can get not only economic data of the St. Louis Fed, but also various data such as stock prices and exchange rates. See DataReader Documentation for more information.
Recommended Posts