Have passed the Python Engineer Certification Data Analysis Exam
It's not difficult, but it's organized knowledge
** [Caution] This article does not directly describe the content of the exam. ** ** I passed as the title says.
 |
 |
|---|---|
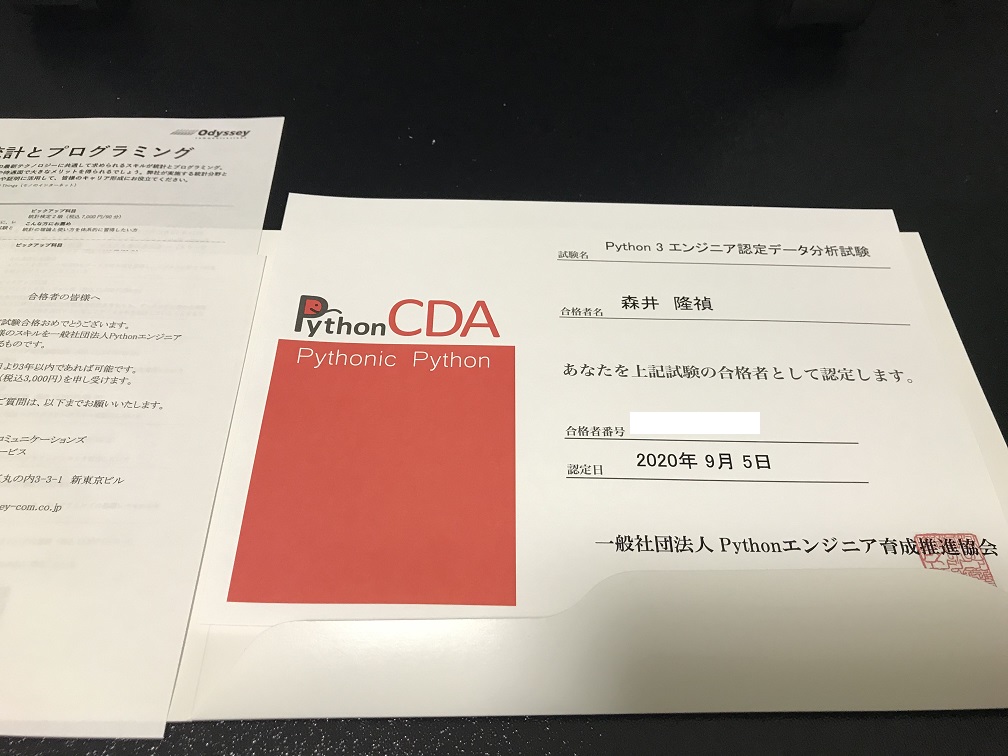
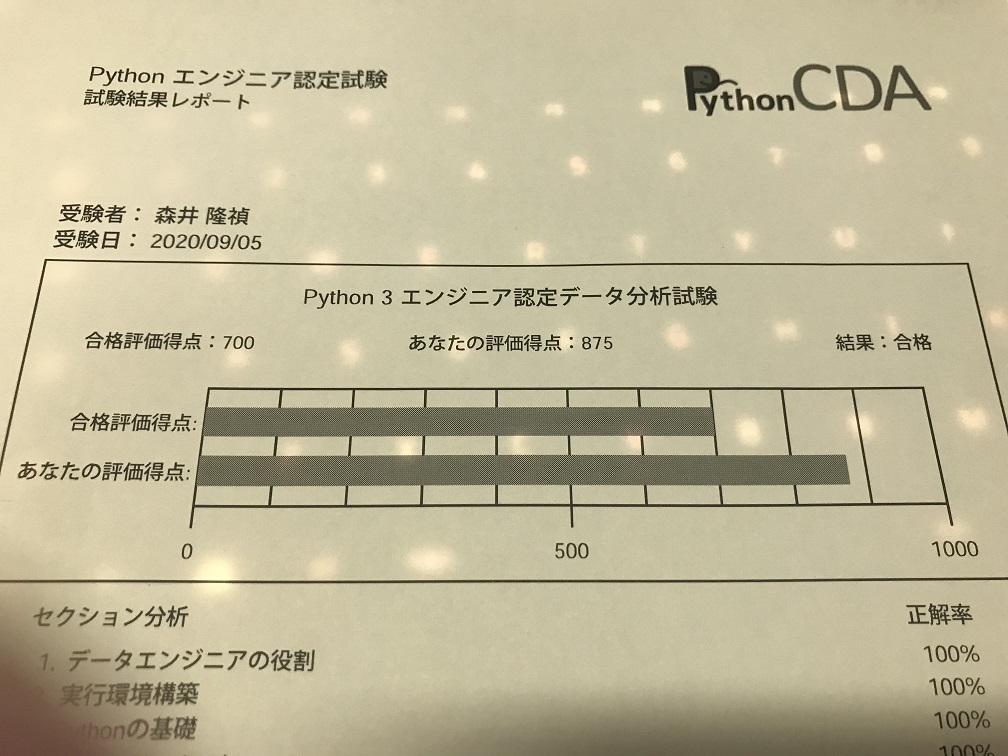
| Python CDA pass certificate | Test results |
The Python engineer certification exam includes a basic exam and a data analysis exam (as of October 27, 2020). At least the data analysis exam isn't that difficult, but you can usually debug it, and you can look up anxious grammar online, but you can't see anything in the exam **. It seems that there were many mistakes because I didn't take any measures seriously. Below are some things to check before taking this exam.
Mathematics / Statistics
First, functions such as exponential logarithm and sine cosine, vector / matrix, and differentiation / integration are essential items. I'm a science student, so I haven't studied for this exam. Probability statistics are also indispensable for data analysis, for example, the frequency distribution table can be output by the return value of ax.hist handled by matplotlib.
range or numpy
Can you definitely answer the following output? There are times when I feel uneasy. Question 1~4
import numpy as np
# Question 1
q1 = range(1, 10, 1)
print( q1 )
# Question 2
q2 = np.arange(1, 10, 1)
print( q2 )
# Question 3
q3 = np.arange(1.0, 10.0, 0.1)
print( q3 )

# Question 4
q4 = [ len( q1 ), len( q2 ), len( q3 ) ]
print( [ f'q{i+1} length = {a}' for i, a in enumerate(q4)] ) # print( q4 )
Answer q1 ~ q4 (may be displayed by default depending on the browser)
# Answer for Question 1
range(1, 10)
# Answer for Question 2
9
# Answer for Question 3
[1.  1.1 1.2 1.3 1.4 1.5 1.6 1.7 1.8 1.9 2.  2.1 2.2 2.3 2.4 2.5 2.6 2.7
 2.8 2.9 3.  3.1 3.2 3.3 3.4 3.5 3.6 3.7 3.8 3.9 4.  4.1 4.2 4.3 4.4 4.5
 4.6 4.7 4.8 4.9 5.  5.1 5.2 5.3 5.4 5.5 5.6 5.7 5.8 5.9 6.  6.1 6.2 6.3
 6.4 6.5 6.6 6.7 6.8 6.9 7.  7.1 7.2 7.3 7.4 7.5 7.6 7.7 7.8 7.9 8.  8.1
 8.2 8.3 8.4 8.5 8.6 8.7 8.8 8.9 9.  9.1 9.2 9.3 9.4 9.5 9.6 9.7 9.8 9.9]
# Answer for Question 4
90
# Answer for Question 1
range(1, 10)
# Answer for Question 2
9
# Answer for Question 3
[1. 1.1 1.2 1.3 1.4 1.5 1.6 1.7 1.8 1.9 2. 2.1 2.2 2.3 2.4 2.5 2.6 2.7
2.8 2.9 3. 3.1 3.2 3.3 3.4 3.5 3.6 3.7 3.8 3.9 4. 4.1 4.2 4.3 4.4 4.5
4.6 4.7 4.8 4.9 5. 5.1 5.2 5.3 5.4 5.5 5.6 5.7 5.8 5.9 6. 6.1 6.2 6.3
6.4 6.5 6.6 6.7 6.8 6.9 7. 7.1 7.2 7.3 7.4 7.5 7.6 7.7 7.8 7.9 8. 8.1
8.2 8.3 8.4 8.5 8.6 8.7 8.8 8.9 9. 9.1 9.2 9.3 9.4 9.5 9.6 9.7 9.8 9.9]
# Answer for Question 4
90
Question 5~8
# Question 5
q5 = [ i for i in range(1, 10, 3) ]
print( q5 )
q6 = q5[-1]
print( q6 )
# Question 7, Which range is true?
# 1<=q7<=9 or 1<=q7<=10 or 2<=q7<=9 or 2<=q7<=10 ?
#q7 = [ random.randint(1, 10) for i in range(100) ]
q7 = random.randint(1, 10)
print( q7 )
# Question 8, Which range is true?
# 1<=q8<=9 or 1<=q8<=10 or 2<=q8<=9 or 2<=q8<=10 ?
#q8 = [ random.randrange(1, 10) for i in range(100)]
q8 = random.randrange(1, 10)
print(q8)
Answer q5 ~ q8 (may be displayed by default depending on the browser)
# Answer for Question 5
[1, 4, 7]
# Answer for Question 6
7
# Answer for Question 7
#ex) 9
1<=q7<=10
# Answer for Question 8
#ex) 4
1<=q8<=9
# Answer for Question 5
[1, 4, 7]
# Answer for Question 6
7
# Answer for Question 7
#ex) 9
1<=q7<=10
# Answer for Question 8
#ex) 4
1<=q8<=9
Lightly the above commentary (range)
In Python, using x = range (a, b) usually results in a <= x <b. Even in the case of Numpy, it will not include 10 like q2 = np.arange (1, 10, 1). The same is true for slices. However, in the case of q7 = random.randint (1, 10), it is not a range, so it is 1 to 10 (including 10). If something like this contains steps like q5 = [i for i in range (1, 10, 3)], or becomes numpy or a decimal like q3 = np.arange (1.0, 10.0, 0.1) , People who are new to Python can be confused. Let's use it well so that you can output the result in your head.
Regular expressions
If you haven't used it, just use "| (or)" and "? (0 or 1 times)".
import re
prog = re.compile('Mori(i|mori)t(a)?k(a)?y(o)?s(hi)?', re.IGNORECASE)
ret = prog.search('Moriitkys')
print(ret[0])
ret = prog.search('Moritkys')
print(ret[0])
---------------------------------------------------------------------------
TypeError                                 Traceback (most recent call last)
<ipython-input-48-3f281450d109> in <module>()
      4 print(ret[0])
      5 ret = prog.search('Moritkys')
----> 6 print(ret[0])

TypeError: 'NoneType' object is not subscriptable
As mentioned above, in the case of (i | mori), either one must be included. On the other hand, in the case of t (a) ?, only either "t" or "ta" is allowed.
Pandas Is it a feature of the data analysis test? Can you memorize the details of Pandas accurately? For example, see the difference between loc and iloc in a data frame.
import pandas as pd
df = pd.DataFrame([[101, "a", True],[102, "b", False],[103, "c", False]])
df.index = ["01", "02", "03"]
df.columns = ["A", "B", "C"]
a1 = df.loc["03", "A"]
a2 = df.iloc[2, 0]
print(a1, a2)
Answer (may be displayed by default depending on the browser)
In both cases, 103 is the output. When specifying an element, specify index or columns for df.loc, and specify the numerical value from 0th for df.iloc. This is also included in the reference book, so if you want to take the exam, you need to memorize it.
In both cases, 103 is the output. When specifying an element, specify index or columns for df.loc, and specify the numerical value from 0th for df.iloc. This is also included in the reference book, so if you want to take the exam, you need to memorize it.
In addition, there are many things to check in df.head, such as how many lines of data should be taken from the head and details of missing value processing (dropna and fillna).
Matplotlib If you feel like it, I will summarize something, but for example, the style of the graph, the setting of the title, etc. are also written in the text, so you need to check it. In particular, graph types (ax.bar, ax.scatter, ax.hist, ax.boxplot, ax.pie, etc.) are required items as the test title of data analysis.
Machine learning
There are various methods for machine learning. Decision tree, principal component analysis, NN, etc. Of course, a data analyst should be able to use everything. However, I think that it is necessary to review the algorithm, explanation of the method, scikit-learn, etc. for the method that is not used often. In the reference book, I felt that supervised learning and unsupervised learning were confused (Isn't that the case?), So you may want to study together with or without supervised learning. Hmm.
Summary of machine learning
・ ** Data preprocessing (missing value processing, feature normalization, etc.) ** For missing value processing, the above-mentioned missing value processing by Pandas is introduced. Please check the reference book for details. Feature normalization requires knowledge such as probability statistics (distributed normalization, maximum normalization, etc.). Also, in pre-processing, it is important to select the feature amount of the data and exclude outliers (outside the test range?), But for the time being, you should check the contents in the reference book.
・ ** Supervised learning ** The reference book explains the support vector machine (SVC of sklearn.svm) and the linear regression model (LinearRegression of sklearn.linear_model), so please check there for details.
・ ** Unsupervised learning ** The reference book explains the decision tree (DecisionTreeClassifier of sklearn.tree), random forest (RandomForestClassifier of sklearn.ensemble), dimension reduction (PCA of sklearn.decomposition), and clustering (KMeans of sklearn.cluster, AgglomerativeClustering of sklearn.cluster). Please check there for details.
・ ** Reinforcement learning ** Only a brief explanation appears in the reference book.
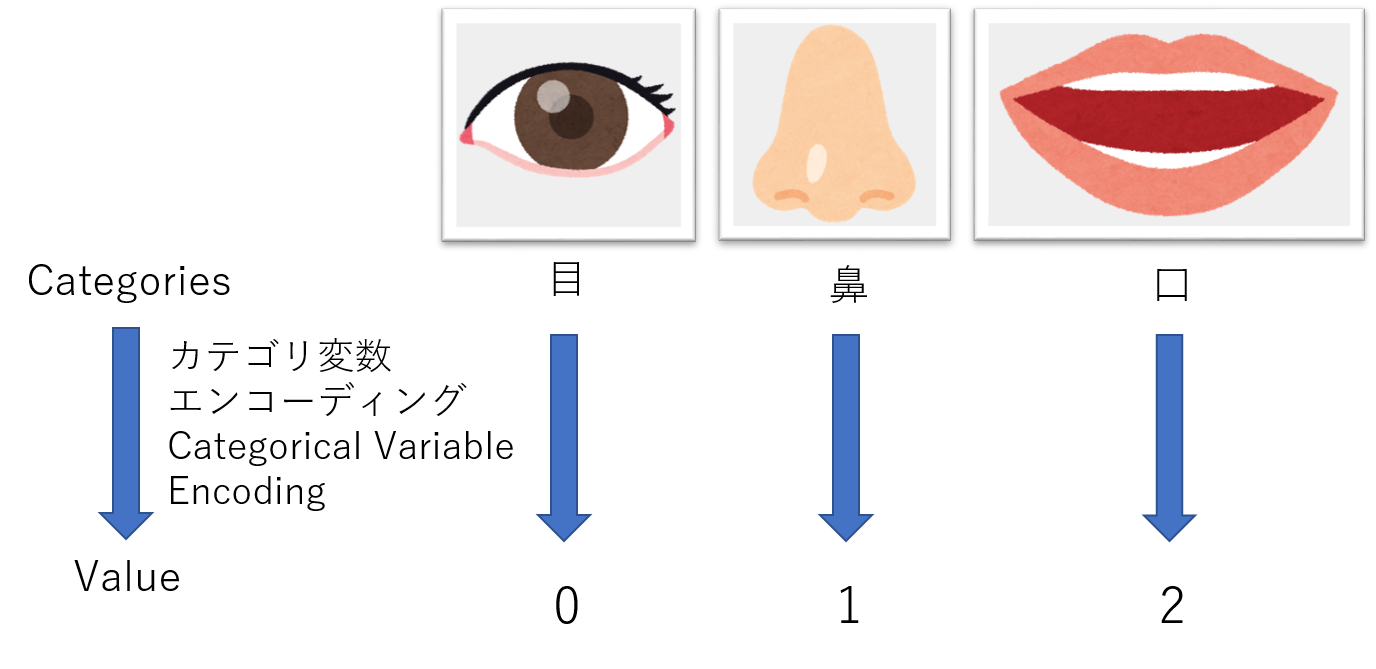
・ ** Variable encoding ** ** [Category variable encoding] ** Humans give names to objects so that they can easily recognize the world in which they live. For example, the two sensory organs attached to the front of the human head that receive light are called "eyes", and the organs for olfaction and breathing attached to the front of the human head are called "nose". Even if the object is interpreted by the character type in this way, if you want to classify it by calculation, the input and output must be a sequence (numerical value). The work of associating the numerical value with the actual target is categorical variable encoding.
 |
|---|
| Conceptual diagram of categorical variable encoding |
Specifically, I will explain where the categorical variable encoding is in the program I made earlier.
 |
|---|
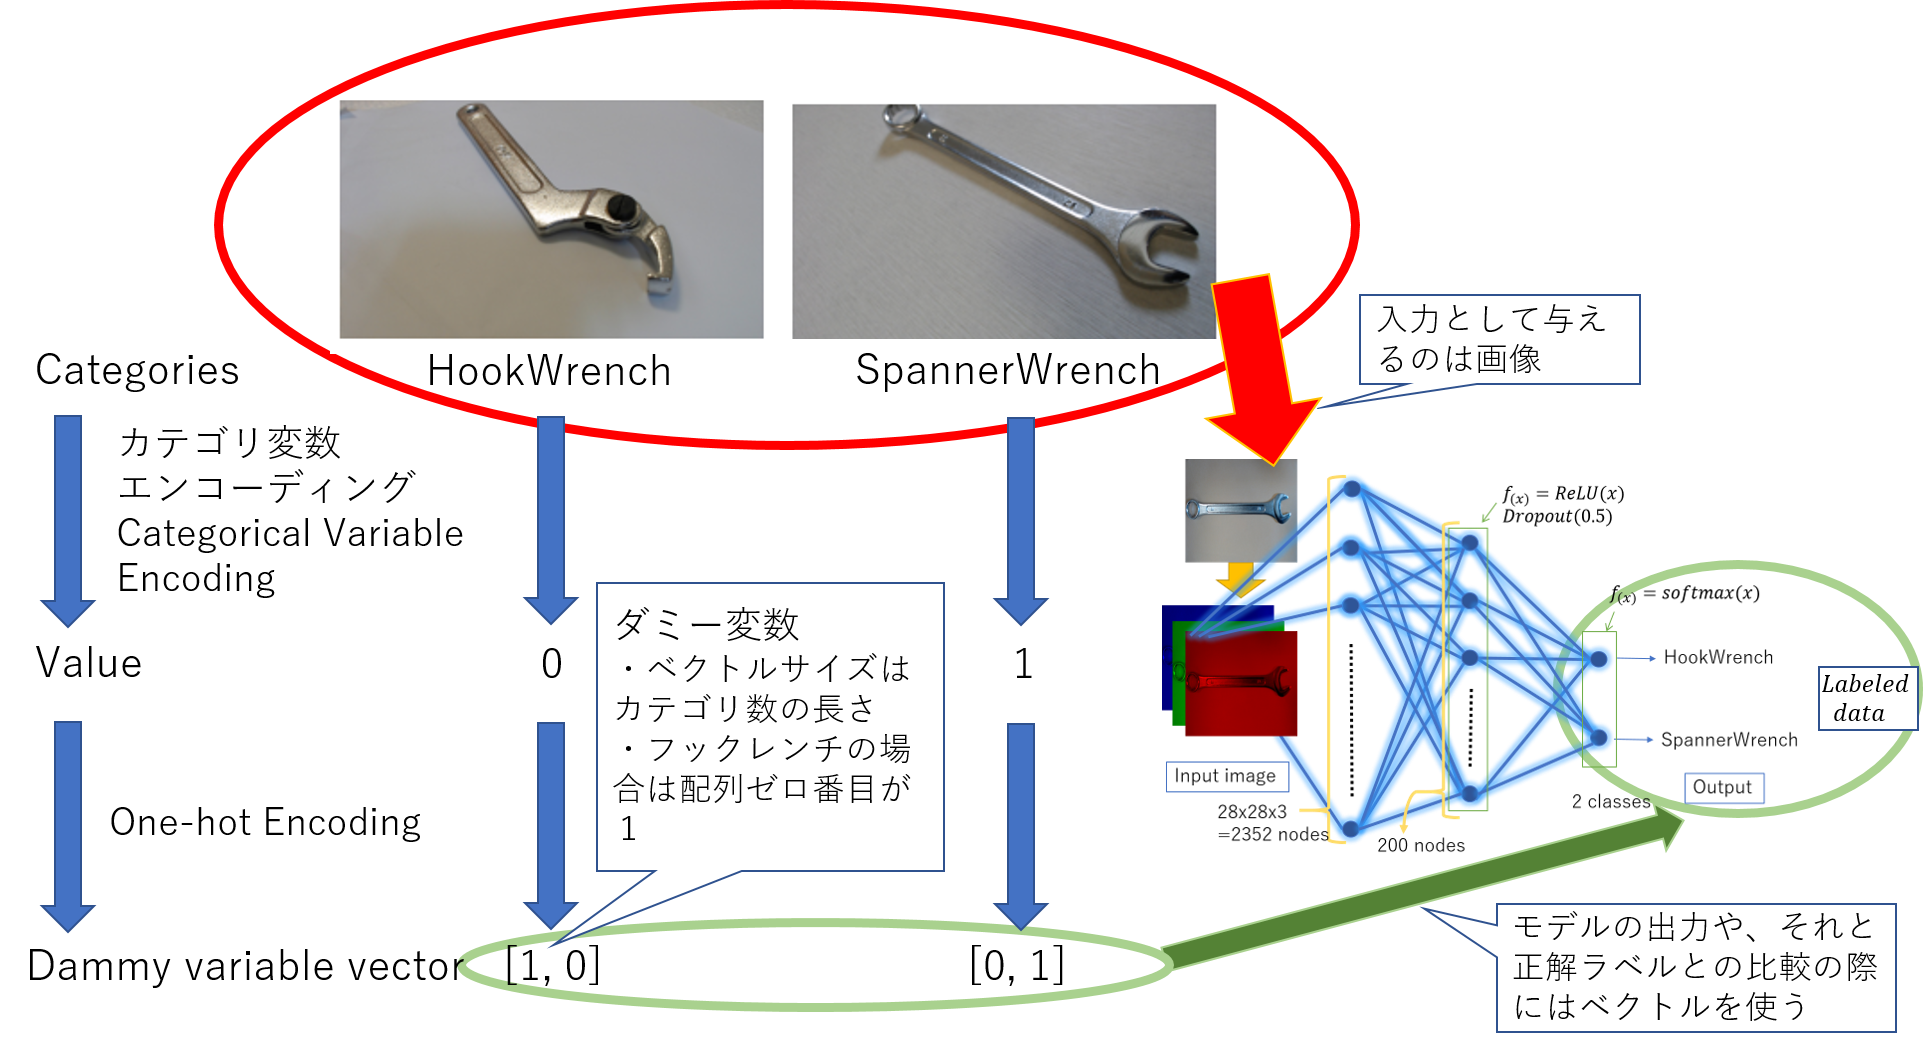
| Category variable encoding, One-Conceptual diagram of hot encoding |
The following page is an article when classifying hook wrenches and spanner wrenches using PyTorch and Keras. https://qiita.com/moriitkys/items/316fcca8d83dfa706597 In this case, the categorical variable encoding is the assignment of the dictionary executed in cell 1, line 56 of the MyOwnNN_pytorch.ipynb program on GitHub (GitHub-moriitkys / MyOwnNN).
#How many classes are in "dataset" folder
categories = [i for i in os.listdir(os.getcwd().replace("/mylib", "") + "/dataset")]
categories_idx = {}#ex) HookWrench:0, SpannerWrench:1
for i, name in enumerate(categories):
    categories_idx[name] = i
nb_classes = len(categories)#ex) nb_classes=2
In this case, the hook wrench is converted to 0 and the spanner wrench is converted to 1. For categorical variable encoding, the method of sklean.preprocessing is introduced in the reference book.
** [One-hot encoding] ** This is also the work required to obtain the desired result by calculation. Since it is often more convenient to treat inputs and outputs as arrays in machine learning, you also need to convert the scalar value dataset as an array. For example, if there are two categories, spanner wrench: 0 and hook wrench: 1, convert the spanner wrench as [1, 0] and the hook wrench as [0, 1].
Specifically, I will explain where the categorical variable encoding is in the program I made earlier. One-hot encoding is around the 13th to 16th lines of cell 3.
y_train1=np_utils.to_categorical(y_train,nb_classes)
y_val1=np_utils.to_categorical(y_val,nb_classes)
Two methods of One-hot encoding, sklean and pandas, are introduced in the reference book.
・ ** Model evaluation ** ** [Category evaluation index] ** I can understand it, but I don't know if I memorize it, so I summarized it. This explanation is also included in the reference book, so it's a good idea to check it.
| Positive example | Negative example | |
|---|---|---|
| Positive example and prediction | TP | FP |
| Negative cases and predictions | FN | TN |
TP (True Positive): Predicted as a positive example and actually a positive example FP (False Positive): Predicted as a positive example, but actually a negative example FN (False Negative): Predicted as a negative example, but actually a positive example TN (True Negative): Predicted as a negative example and actually a negative example
** Compliance rate **: Percentage of actual positive cases out of the predicted positive cases. ・ Compliance rate formula P = TP / (TP + FP) ・ The precision rate is considered to be an index of how small the mistakes in the prediction class can be. ** Recall rate **: Percentage of actual positive cases predicted to be positive. ・ Recall rate formula R = TP / (TP + FN) ・ There is a trade-off between recall and precision. ** F value **: Harmonic mean of precision and recall. ・ F = 2PR / (P + R) ・ Indicator that improves the balance between P and R ** Correct answer rate **: Percentage of data whose forecast and actual results match ・ Correct answer rate formula A = (TP + TN) / (TP + FP)
** [Accuracy of prediction probability] ** If you know it, there is nothing wrong with it, but the reference book mentions the ROC curve (roc_curve in sklearn.metrics).
Summary
You should study properly. I don't think it's possible to do something like rote memorization. Memorizing reference books may be useful, but it should be understood.
Reference book
New textbook for data analysis using Python (Manabu Terata, Shingo Tsuji, Takanori Suzuki, Shintaro Fukushima)
Author of this article
moriitkys Takayoshi Morii Make a robot. I'm interested in AI / Robotics / 3D Graphics. Recently, I've been thinking about how to make money, and I'm planning to make hardware with that money. Qualification / Certification: G test, Python engineer certification data analysis test, AI implementation test A grade, TOEIC: 810 (2019/01/13)
Recommended Posts