[PYTHON] Draw a graph with Julia + PyQtGraph (3)
"Draw a graph in the programming language Julia" I succeeded in moving the sample for the time being, but the data created by my own program (in Julia language) I decided to find out how to draw a graph using. I made a sample to draw a graph in 3D space. (Refer to the sample of PyQtGraph, the calculation processing part was ported to Julia side) As usual, the calculation result obtained by Julia is displayed as a graph in PyQtGraph. (Please create an environment and move it)
- GLLinePlot.jl (Julia source code) passes an array to a function called graph_run () in the Python source. Let Python draw the graph for you. ..
- GLLinePlot.py (Python source code) draws a 3D graph based on the array passed by Julia (51 line graphs).
- When calling Python code using PyCall, C: \ julia-0.2.1-win32 \ bin is included in the load path, so both GLLinePlot.jl and GLLinePlot.py are C: \ julia- Save it under 0.2.1-win32 \ bin.
- When saving the source code, the character encoding should be utf-8.
- To launch the sample, double-click GLLinePlot.jl (Julia source code) from Explorer.
Note: For the environment construction, refer to "Drawing a graph in the programming language Julia".
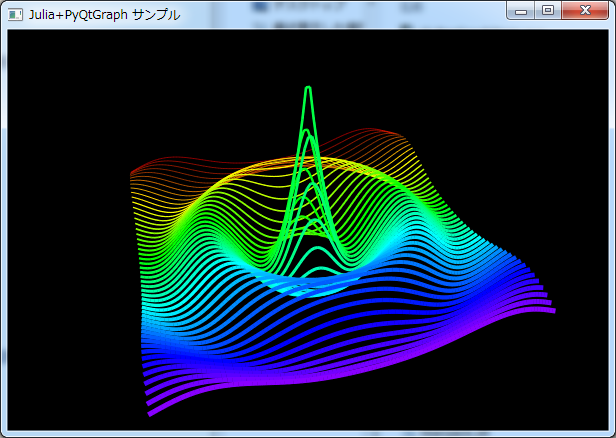 ↑ Drag with the mouse or press the cursor key to rotate the 3D graph. You can zoom in / out by turning the mouse wheel.
jl:GLLinePlot.jl(C:\julia-0.2.1-win32\Save to bin)
# -*- coding: utf-8 -*-

using PyCall

nx = 100
ny = 51
x = linspace(-10, 10, nx)
y = linspace(-10, 10, ny)
z = zeros(Float64, length(x), length(y))

for iy = 1:length(y)
    for ix = 1:length(x)
        d = (x[ix]^2 + y[iy]^2)^0.5
        z[ix, iy] = 10 * cos(d) / (d+1)
    end
end

@pyimport GLLinePlot
GLLinePlot.graph_run(x, y, z)
python:GLLinePlot.py(C:\julia-0.2.1-win32\Save to bin)
# -*- coding: utf-8 -*-

from pyqtgraph.Qt import QtCore, QtGui
import pyqtgraph.opengl as gl
import pyqtgraph as pg
import numpy as np

def graph_run(plot_data_x, plot_data_y, plot_data_z):

    app = QtGui.QApplication([])

    w = gl.GLViewWidget()
    w.resize(600,400)
    w.opts['distance'] = 40
    w.show()
    w.setWindowTitle(u'Julia+PyQtGraph sample')

    x = plot_data_x
    y = plot_data_y
    for i in range(len(y)):
        yi = [y[i]]*len(x)
        z = plot_data_z[:,i]
        pts = np.vstack([x,yi,z]).transpose()
        plt = gl.GLLinePlotItem(pos=pts, color=pg.glColor((i,len(y)*1.3)), width=(i+1)/10., antialias=True)
        w.addItem(plt)

    app.exec_()