[PYTHON] [pyqtgraph] Add region to the graph and link it with the graph region
Thing you want to do
I want to add a region to the main graph and display that region in another graph

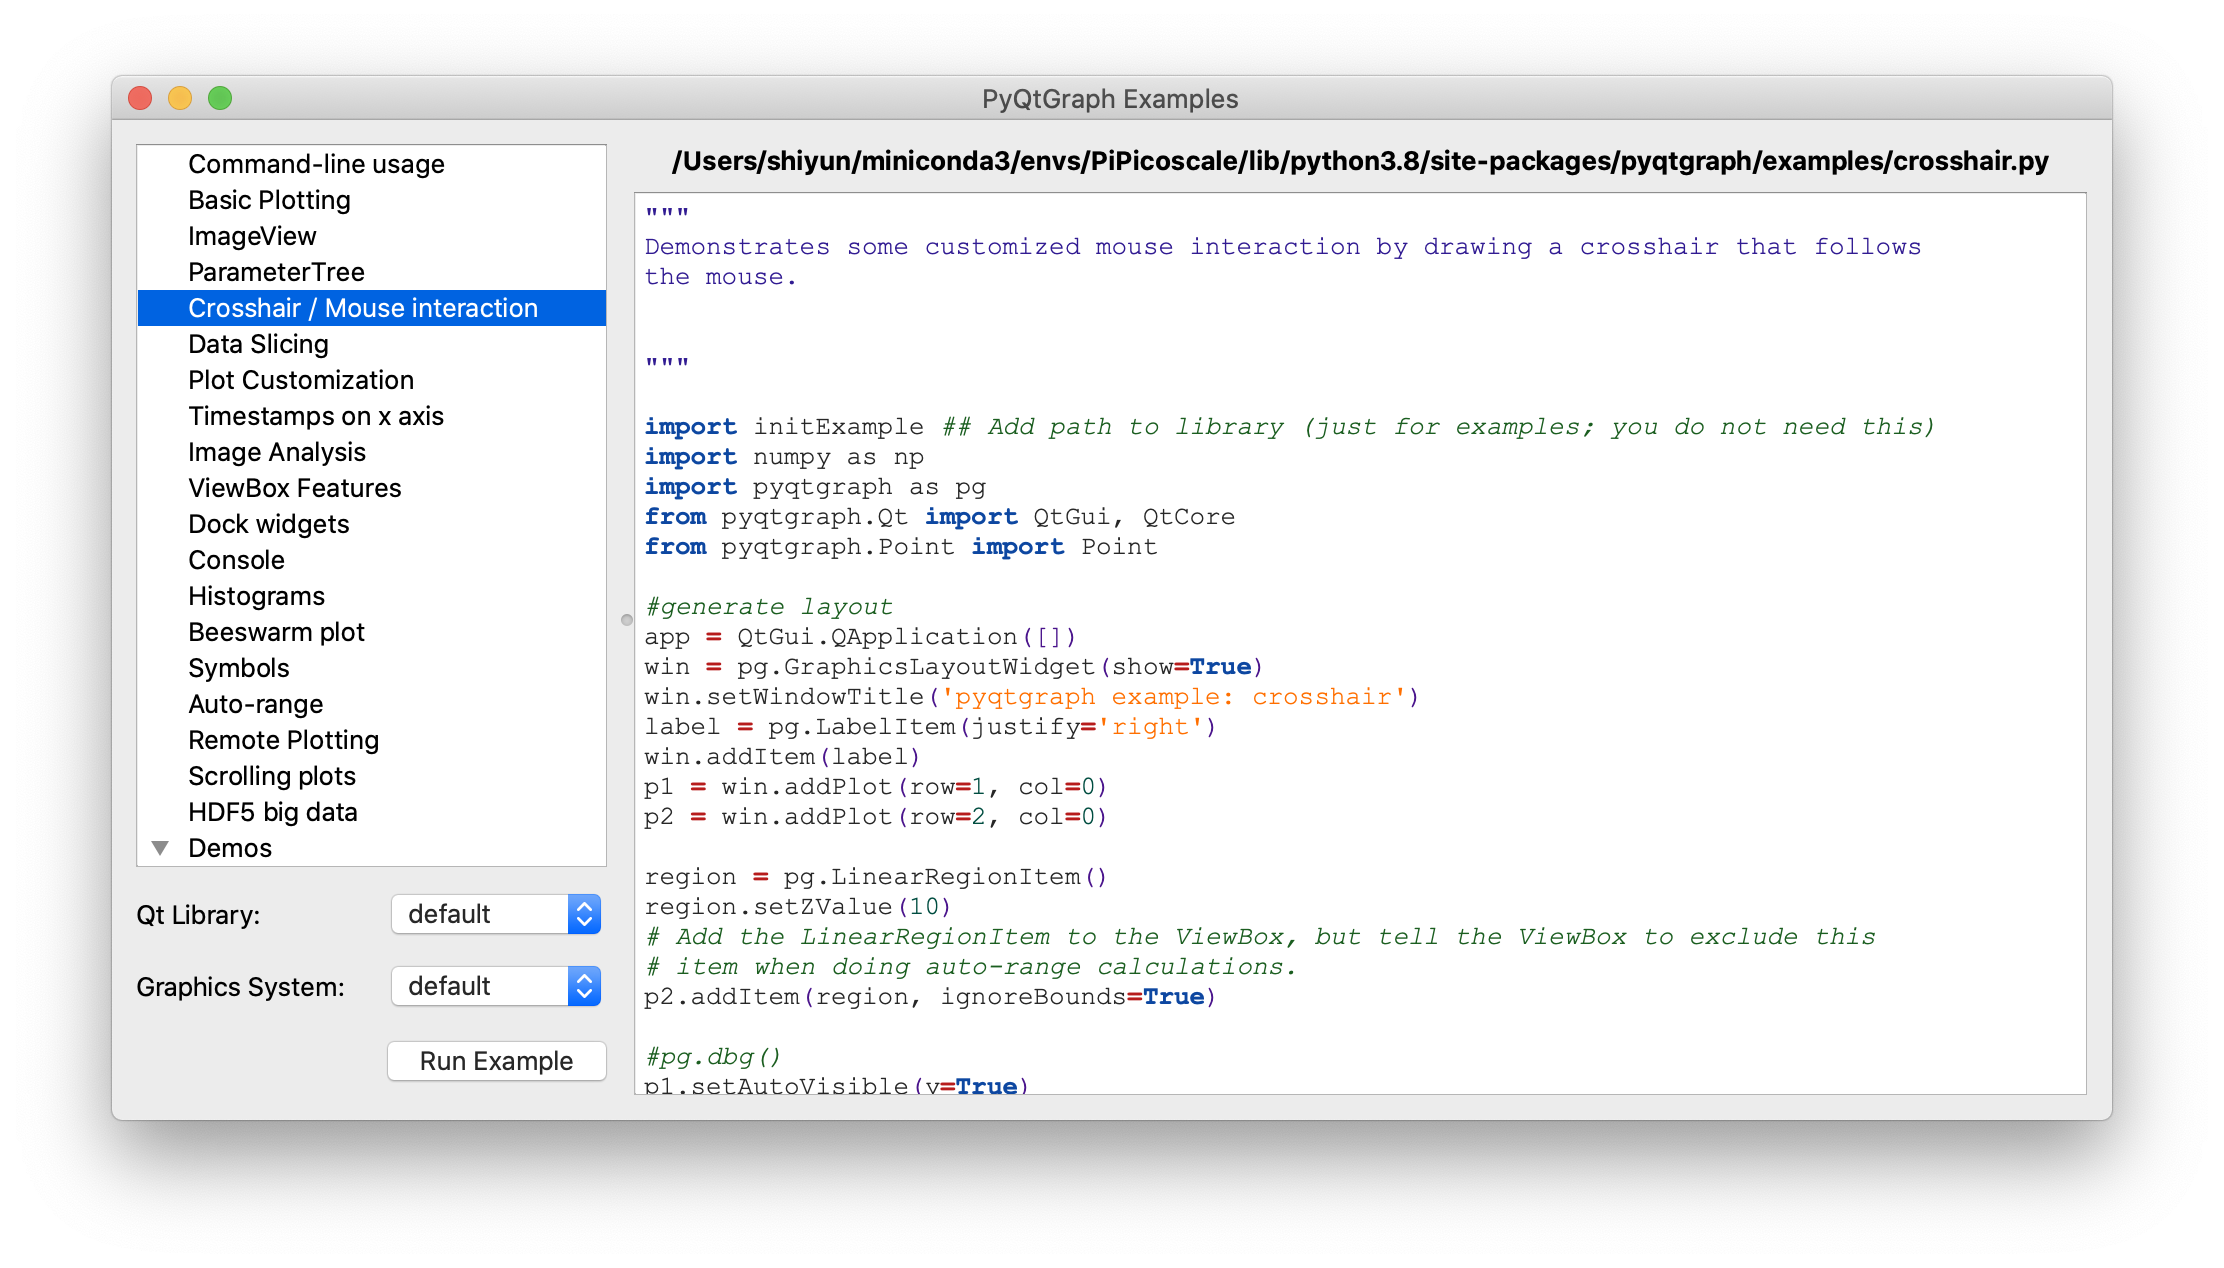
Create while referring to Crosshair / Mouse interaction of pyqtgraph.exsamples.run ()

environment
Mac OS Python 3.8.5
PyQt5 5.15.2 PyQt5-sip 12.8.1 pyqtgraph 0.11.1
pip install PyQt5 PyQt5-sip pyqtgraph
pyqtgraph.exsamples
import pyqtgraph.examples as ex
ex.run()
You can see various sample graphs at. I referred to Crosshair / Mouse interaction this time.
code
I'm using numpy for plotting. pip install numpy
"""Add region to the graph and link it with the graph region"""

import dataclasses
from typing import Optional
import sys

import numpy as np
from PyQt5 import QtWidgets, QtCore
import pyqtgraph as pg

SAMPLE_DATA1 = np.random.rand(500) * 10
SAMPLE_DATA2 = 10 + np.random.rand(500) * 10
SAMPLE_DATA3 = 20 + np.random.rand(500) * 10


@dataclasses.dataclass
class AddRegionWidget(pg.GraphicsLayoutWidget):
    """Main screen
    Attributes #
    ----------
    parent: Optional[QtWidgets.QWidget] default=None
Parent screen
    main_plotter: pyqtgraph.graphicsItems.PlotItem.PlotItem.PlotItem
Main graph
    zoom_plotter: pyqtgraph.graphicsItems.PlotItem.PlotItem.PlotItem
A graph that zooms the main graph in the region
    region: pyqtgraph.graphicsItems.LinearRegionItem.LinearRegionItem
        zoom_region that specifies the x-axis region of the plotter
    """
    parent: Optional[QtWidgets.QWidget] = None

    def __post_init__(self) -> None:
        """Superclass loading and plot,region added"""
        super(AddRegionWidget, self).__init__(parent=self.parent)

        self.add_plot()
        self.add_region()
        self.connect_slot()

    def add_plot(self) -> None:
        """add plot"""
        self.main_plotter = self.addPlot(row=0, col=0)
        self.main_plotter.showGrid(x=True, y=True, alpha=0.8)
        main_curve1 = self.main_plotter.plot(pen=pg.mkPen('#f00'))
        main_curve2 = self.main_plotter.plot(pen=pg.mkPen('#0f0'))
        main_curve3 = self.main_plotter.plot(pen=pg.mkPen('#00f'))
        main_curve1.setData(SAMPLE_DATA1)
        main_curve2.setData(SAMPLE_DATA2)
        main_curve3.setData(SAMPLE_DATA3)

        self.zoom_plotter = self.addPlot(row=0, col=1)
        #Adjust the y-axis according to the value
        self.zoom_plotter.setAutoVisible(y=True)
        self.zoom_plotter.showGrid(x=True, y=True, alpha=0.8)
        zoom_curve1 = self.zoom_plotter.plot(pen=pg.mkPen('#f00'))
        zoom_curve2 = self.zoom_plotter.plot(pen=pg.mkPen('#0f0'))
        zoom_curve3 = self.zoom_plotter.plot(pen=pg.mkPen('#00f'))
        zoom_curve1.setData(SAMPLE_DATA1)
        zoom_curve2.setData(SAMPLE_DATA2)
        zoom_curve3.setData(SAMPLE_DATA3)

        self.zoom_plotter.setXRange(0.0, len(SAMPLE_DATA1) / 8, padding=0)

        self.ci.layout.setColumnStretchFactor(0, 8)
        self.ci.layout.setColumnStretchFactor(1, 5)

    def add_region(self) -> None:
        """Add region"""
        self.region = pg.LinearRegionItem()
        #Region height setting. There are multiple regions&If they overlap, the one with the higher Z can be operated.(Since there is only one this time, set it to 10 appropriately)
        self.region.setZValue(10)
        self.main_plotter.addItem(self.region, ignoreBounds=True)
        self.update_region()

    def connect_slot(self) -> None:
        """slot connection"""
        self.region.sigRegionChanged.connect(self.update_zoom_plotter)
        self.zoom_plotter.sigRangeChanged.connect(self.update_region)

    @QtCore.pyqtSlot()
    def update_zoom_plotter(self) -> None:
        """self when the region moves.zoom_Change plotter area"""
        self.region.setZValue(10)
        min_x, max_x = self.region.getRegion()
        self.zoom_plotter.setXRange(min_x, max_x, padding=0)

    @QtCore.pyqtSlot()
    def update_region(self) -> None:
        """self.zoom_Change the region of the region when the plotter moves
viewRange returns the display range of the graph. The type is
        [[Xmin, Xmax], [Ymin, Ymax]]
        """
        rgn = self.zoom_plotter.viewRange()[0]
        self.region.setRegion(rgn)


def main() -> None:
    app = QtWidgets.QApplication(sys.argv)
    window = AddRegionWidget(parent=None)
    window.show()
    sys.exit(app.exec_())


if __name__ == "__main__":
    main()
Details
Change the zoom_plotter range when the region changes
    @QtCore.pyqtSlot()
    def update_zoom_plotter(self) -> None:
        """self when the region moves.zoom_Change plotter area"""
        self.region.setZValue(10)
        min_x, max_x = self.region.getRegion()
        self.zoom_plotter.setXRange(min_x, max_x, padding=0)
min_x, max_x are the x-coordinates of the region.
ex) min_x=231.1511878655732 max_x=293.6511878655732
It is specified in the x-axis range of zoom_potter.
padding = 0 is an image with no margins.
For example, when self.zoom_plotter.setXRange (100, 1000, padding = 0.1), the actual displayed range is [100 * (1-0.1), 1000 * (1 + 0.1)] [90, 1100 ] .
I set it to 0 because I want to match the range of region and the range of zoom_plotter.
Change the range of region when the range of zoom_plotter changes
    @QtCore.pyqtSlot()
    def update_region(self) -> None:
        """self.zoom_Change the region of the region when the plotter moves
viewRange returns the display range of the graph. The type is
        [[Xmin: float, Xmax: float], [Ymin: float, Ymax: float]]
        """
        rgn = self.zoom_plotter.viewRange()[0]
        self.region.setRegion(rgn)
When you change the range of zoom_plotter directly, the range of region is adjusted accordingly.
The range of [Xmin: float, Xmax: float] is set to region with setRegion.
Other region settings
Creating a landscape region
horizontal_region = pg.LinearRegionItem(orientation='horizontal')
region Color settings in the region
region = pg.LinearRegionItem(brush=pg.mkBrush('#f004'))
You can pass colors other than \ #RGBA.
| ‘c’ | one of: r, g, b, c, m, y, k, w | | -------------- | ------------------------------------------------------------ | | R, G, B, [A] | integers 0-255 | | (R, G, B, [A]) | tuple of integers 0-255 | | float | greyscale, 0.0-1.0 | | int | see
intColor()| | (int, hues) | seeintColor()| | “RGB” | hexadecimal strings; may begin with ‘#’ | | “RGBA” | | | “RRGGBB” | | | “RRGGBBAA” | | | QColor | QColor instance; makes a copy. |
PyQtGraph’s Helper Functions — pyqtgraph 0.11.1.dev0 documentation
region Border color setting (color can be specified in the same way as above)
region = pg.LinearRegionItem(pen=pg.mkPen('#fff'))
In-region color setting when the cursor is on the region
region = pg.LinearRegionItem(hoverBrush=pg.mkBrush('#fff4'))
Border color setting when the cursor is on the border of a region
region = pg.LinearRegionItem(hoverPen=pg.mkPen('#f00'))
reference
Crosshair / Mouse interaction in pyqtgraph.exsamples.run ()
region LinearRegionItem — pyqtgraph0.11.1.dev0 documentation
region color setting PyQtGraph’s Helper Functions — pyqtgraph 0.11.1.dev0 documentation
Recommended Posts