[PYTHON] [Translation] scikit-learn 0.18 User Guide 2.7. Detection of novelty and outliers
Google translated http://scikit-learn.org/0.18/modules/outlier_detection.html [scikit-learn 0.18 User Guide 2. Unsupervised Learning](http://qiita.com/nazoking@github/items/267f2371757516f8c168#2-%E6%95%99%E5%B8%AB%E3%81%AA From% E3% 81% 97% E5% AD% A6% E7% BF% 92)
2.7. Detection of novelty and outliers
Many applications need to be able to determine whether a new observation belongs to the same distribution (inlier) as an existing observation (outlier) or is different (outlier). This feature is often used to erase the actual dataset. Two important distinctions must be made:
- ** Novelty detection: **
- Since the training data is not contaminated by outliers, we are interested in detecting anomalies with new observations.
- ** Outlier detection: **
- The training data contains outliers and the deviant observations should be ignored to fit into the central mode of the training data.
The scikit-learn project provides a set of machine learning tools that can be used for both novelty and outlier detection. This strategy is implemented with objects that learn from data unsupervised.
estimator.fit(X_train)
You can sort the new observations as outliers or inliers using forecasting methods.
estimator.predict(X_train)
The inlier is labeled 1 and the outlier is labeled -1.
2.7.1. Detection of novelty
Consider a dataset of $ n $ observations with the same distribution described by $ p $ features. Now consider adding another observation to that dataset. Are the new observations so different from other observations? (Ie, does it come from the same distribution?) Or, conversely, is it indistinguishable from the original observation because it is similar to others? This is a problem addressed by novelty detection tools and methods. In general, it is trying to learn the rough, close boundaries that outline the initial observations, plotted by embedding the $ p $ dimensional space. Then, if further observations are within the frontier delimited subspace, they are considered to be from the same population as the first observation. Otherwise, if they lie outside the frontier, we can say that they are anomalous with some confidence in our assessment. One-class SVM was introduced by Schölkopf et al. For that purpose, the svm.OneClassSVM object's Support Vector Machines ( http://qiita.com/nazoking@github/items/2b16be7f7eac940f2e6a) It is implemented in the module. To define the frontier, you need to select the kernel and scalar parameters. RBF kernels usually do not have an exact formula or algorithm to set the bandwidth parameter, but they are chosen. This is the default for the scikit-learn implementation. The $ \ nu $ parameter, also known as the One-Class SVM margin, corresponds to the probability of finding new but regular observations outside the frontier.
- References:
- Estimating support for higher dimensional distributions Schölkopf, Bernhard, et al. Neural Computing 13.7 (2001): 1443-1471.
- Example:
- svm.OneClassSVM The frontier learned around some data by objects For visualization, [1 class SVM with non-linear kernel (RBF)](http://scikit-learn.org/0.18/auto_examples/svm/plot_oneclass.html#sphx-glr-auto-examples-svm-plot See -oneclass-py).
2.7.2. Outlier detection
Outlier detection is similar to novelty detection in that it separates the core of normal observations from some contaminated material (called "outliers"). However, in the case of outlier detection, we do not have a clean dataset that represents a population of regular observations that can be used to train any tool.
2.7.2.1. Install an oval envelope
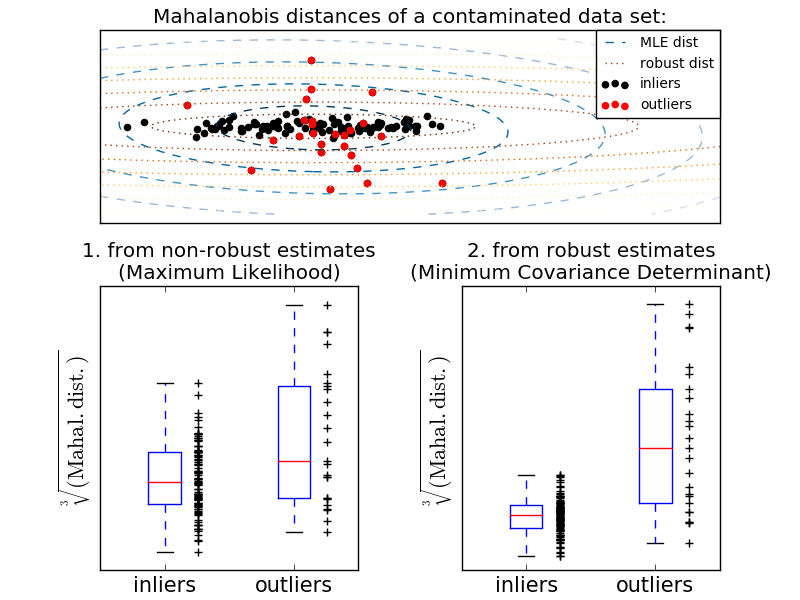
One common way to perform outlier detection is to assume that the normal data comes from a known distribution (eg, the data is a Gaussian distribution). From this assumption, we generally try to define the "shape" of the data, and the deviation value can be defined as an observation value well away from the fit shape. scikit-learn provides covariance of objects. The elliptical envelope fits a robust covariance estimate to the data, ignoring points other than center mode and fitting the ellipse to the center data point. For example, assuming the inlier data is Gaussian, we estimate the inlier position and covariance in a robust way (ie, unaffected by outliers). The Mahalanobis distance obtained from this estimate is used to derive a measure of exogenousness. This strategy is shown below.
- Example:
- Standards (covariance.EmpiricalCovariance) to assess the degree of deviation from observations. ) Or the use of covariance with the location of a robust estimate (covariance.MinCovDet) To explain the difference, see [Relationship between Robust Covariance Estimate and Maharanobis Distance](http://scikit-learn.org/0.18/auto_examples/covariance/plot_mahalanobis_distances.html#sphx-glr-auto-examples-covariance- See plot-mahalanobis-distances-py).
- References:
- [RD1999] Rousseeuw, P.J., Van Driessen, K. "Fast Algorithm for Minimum Covariance Determinant Estimator" Technometrics 41 (3), 212 (1999)
2.7.2.2. Isolation forest
One efficient way to detect outliers in high-dimensional datasets is to use a random forest. ensemble.IsolationForest randomly selects features and maximizes the selected features. "Separate" the observations by randomly choosing a split between the value and the minimum. Recursive splits can be represented in a tree structure, so the number of splits required to separate a sample corresponds to the path length from the root node to the end node. The length of this path, averaged on such a random tree forest, is a measure of normality and judgment. Random division produces a significantly shorter path for anomalies. Therefore, if a random tree forest generically produces shorter path lengths for a particular sample, they are likely to be anomalous. This strategy is shown below.

- Example:
- For examples of using IsolationForest, see [IsolationForest Examples](http://scikit-learn.org/0.18/auto_examples/ensemble/plot_isolation_forest.html#sphx-glr-auto-examples-ensemble-plot-isolation-forest- See py).
- Abnormal value detection by several methods Please refer to. ensemble.IsolationForest and svm.OneClassSVM .org / 0.18 / modules / generated / sklearn.svm.OneClassSVM.html # sklearn.svm.OneClassSVM) (tuned to detect outliers) and [covariance.MinCovDet](http://scikit- Compare covariance-based outlier detection using learn.org/0.18/modules/generated/sklearn.covariance.MinCovDet.html#sklearn.covariance.MinCovDet).
- References:
- [LTZ2008] Liu, Fei Tony, Ting, Kai Ming, Zhou, Zhi-Hua. "Separated Forest" Data Mining, 2008. ICDM '08. 8th IEEE International Conference
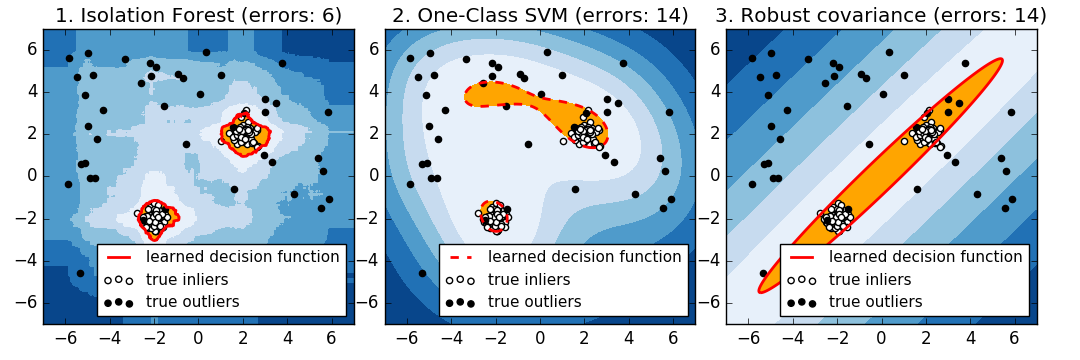
2.7.2.3. 1 Class SVM vs. Elliptical Envelope vs. Isolation Forest
Strictly speaking, a 1-class SVM is a new detection method, not an outlier detection method: the training set should not be contaminated as it is fitted by outliers. In short, it is very difficult to detect outliers in higher dimensions, or to make no assumptions about the distribution of underlying data, and One-class SVMs provide useful results in these situations. The following example shows how the performance of covariance degrades with less data.
svm.OneClassSVM works well with data with multiple modes and ensembles. IsolationForest works well in all cases.
Comparison of 1-class SVM approach and elliptical envelope
For well centered oval inlier mode, svm.OneClassSVM You cannot benefit from the rotational symmetry of the inlier population. In addition, it fits slightly into the outliers present in the training set. Conversely, covariance.EllipticEnvelope based on fitting the covariance is an inlier distribution. Learn an ellipse that looks a lot like. ensemble.IsolationForest works as well.

Elliptic Envelope does not fit inliers well when the inlier distribution becomes bimodal. However, covariance.EllipticEnvelope and svm.OneClassSVM In both -learn.org/0.18/modules/generated/sklearn.svm.OneClassSVM.html#sklearn.svm.OneClassSVM), it is difficult to detect the two modes, svm.OneClassSVM You can see that -learn.org/0.18/modules/generated/sklearn.svm.OneClassSVM.html#sklearn.svm.OneClassSVM) tends to override. Since there is no model for inliers, areas where some outliers are clustered are interpreted as inliers.

If the inlier distribution is strong and not Gaussian, svm.OneClassSVM is [ensemble.IsolationForest] ](Http://scikit-learn.org/0.18/modules/generated/sklearn.ensemble.IsolationForest.html#sklearn.ensemble.IsolationForest) can restore a reasonable approximation, but covariance.EllipticEnvelope fails completely.
- Example:
- For examples of using IsolationForest, see [IsolationForest Examples](http://scikit-learn.org/0.18/auto_examples/ensemble/plot_isolation_forest.html#sphx-glr-auto-examples-ensemble-plot-isolation-forest- See py).
- Abnormal value detection by several methods Please refer to. ensemble.IsolationForest and svm.OneClassSVM .org / 0.18 / modules / generated / sklearn.svm.OneClassSVM.html # sklearn.svm.OneClassSVM) (tuned to detect outliers) and [covariance.MinCovDet](http://scikit- Compare covariance-based outlier detection using learn.org/0.18/modules/generated/sklearn.covariance.MinCovDet.html#sklearn.covariance.MinCovDet).
[scikit-learn 0.18 User Guide 2. Unsupervised Learning](http://qiita.com/nazoking@github/items/267f2371757516f8c168#2-%E6%95%99%E5%B8%AB%E3%81%AA From% E3% 81% 97% E5% AD% A6% E7% BF% 92)
© 2010 --2016, scikit-learn developers (BSD license).
Recommended Posts