[PYTHON] Comparison of k-means implementation examples of scikit-learn and pyclustering
Introduction
The de facto standard for implementing machine learning in Python is scikit-learn, but pyclustering is an option because some of the itchy parts of clustering are out of reach.
However, pyclustering is a little difficult to use compared to scikit-learn, so I will summarize the implementation example in the most basic k-means as a reminder of how to use it.
Execution example of K-means
Usage data
Data definition
from sklearn.datasets import make_blobs

X, _ = make_blobs(n_features=2, centers=5, random_state=1)
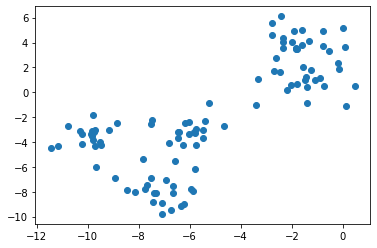
Scatter plot
import matplotlib.pyplot as plt

plt.scatter(X[:, 0], X[:, 1])
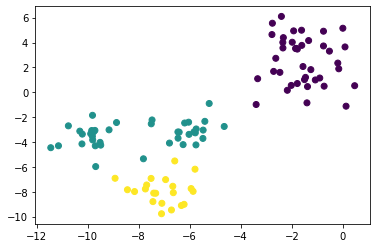
scikit-learn
The implementation of k-means using scikit-learn is as follows.
The initial value setting method in scikit-learn can be set with the ʻinit` option, and ha is the default. It is k-means ++.
scikit-k in learn-means
from sklearn.cluster import KMeans

sk_km = KMeans(n_clusters=3).fit(X)
plt.scatter(X[:, 0], X[:, 1], c=sk_km.labels_)
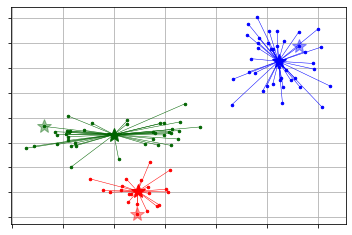
pyclustering
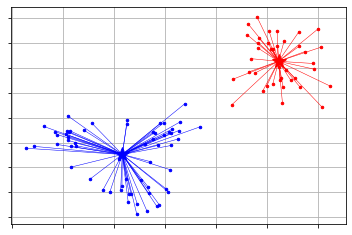
The implementation of k-means using pyclustering is as follows.
Unlike scikit-learn, it is necessary to specify the initial value setting and the subsequent cluster learning separately. Later, if you use the visualization function provided here, the information will be a little richer.
from pyclustering.cluster import kmeans
from pyclustering.cluster.center_initializer import kmeans_plusplus_initializer

initial_centers = kmeans_plusplus_initializer(X, 3).initialize()  # k-means++Initial value setting with
pc_km = kmeans.kmeans(X, initial_centers)  #definition of kmeans class
pc_km.process()  #Execution of learning

_ = kmeans.kmeans_visualizer.show_clusters(X, pc_km.get_clusters(), pc_km.get_centers(), initial_centers=initial_centers)  #Visualization
The clusters obtained by pyclustering can be referenced with the predict and get_clusters methods.
predict returns a label for the input data, similar to scikit-learn.
get_clusters returns the index for the data used for training by cluster. This is not suitable for handling with pandas etc., so it needs to be processed separately. (Easier to use predict)
Obtaining the cluster number using predict(1)
labels = pc_km.predict(X)
get_Get the cluster number using clusters
import numpy as np

clusters = pc_km.get_clusters()
labels = np.zeros((np.concatenate([np.array(x) for x in clusters]).size, ))
for i, label_index in  enumerate(clusters):
    labels[label_index] = i
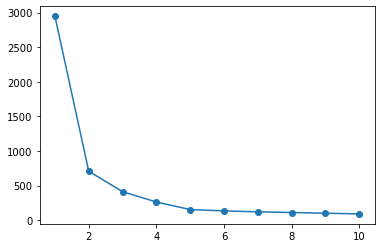
Determining the number of clusters
scikit-learn
The elbow method in scikit-learn is shown.
Silhouette analysis is also possible, but it will be omitted because the implementation will be complicated like pyclustering.
In either case, the number of clusters cannot be determined automatically, and it must be determined after confirmation by the analyst.
Elbow method
sse = list()
for i in range(1, 11):
    km = KMeans(n_clusters=i).fit(X)
    sse.append(km.inertia_)

plt.plot(range(1, 11), sse, 'o-')
pyclustering
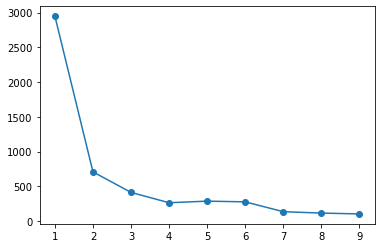
In the case of pyclustering, the elbow method even determines the number of clusters. As for the number of clusters, it seems that the number of clusters whose sum of squares of error within the cluster is greatly reduced within the search range is adopted.
Elbow method
from pyclustering.cluster.elbow import elbow

kmin, kmax = 1, 10  #Range to search
elb = elbow(X, kmin=kmin, kmax=kmax)  #The search range is kmin~kmax-Note up to 1
elb.process()
elb.get_amount()  #You can see the number of clusters

plt.plot(range(kmin, kmax), elb.get_wce())
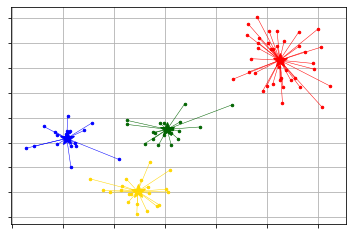
Since pyclustering supports x-means and g-means, you can also use it.
x-means
from pyclustering.cluster import xmeans
from pyclustering.cluster.kmeans import kmeans_visualizer

initial_centers = xmeans.kmeans_plusplus_initializer(X, 2).initialize() # k=Search with 2 or more
xm = xmeans.xmeans(X, initial_centers=initial_centers, )
xm.process()

_ = kmeans_visualizer.show_clusters(X, xm.get_clusters(), xm.get_centers())
g-means
from pyclustering.cluster import gmeans
from pyclustering.cluster.kmeans import kmeans_visualizer

initial_centers = gmeans.kmeans_plusplus_initializer(X, 2).initialize()
gm = gmeans.gmeans(X, initial_centers=initial_centers, )
gm.process()

_ = kmeans_visualizer.show_clusters(X, gm.get_clusters(), gm.get_centers())
Advantages of pyclustering over scikit-learn
Scikit-learn is the best choice for low thresholds, but pyclustering is superior if you want to fine-tune the clustering algorithm.
Many algorithms that support pyclustering are supported in the first place, and the processing contents can be defined in detail. For example, the distance definition can be changed from Euclidean distance to Manhattan distance or user-defined distance index.
The following is an example of performing cluster phosphorus at the cosine distance.
- If you just do it with the cosine distance, spherecluster is easier.
K in cosine distance-means
import numpy as np
from pyclustering.cluster import kmeans
from pyclustering.cluster.center_initializer import kmeans_plusplus_initializer
from pyclustering.utils.metric import distance_metric, type_metric

X = np.random.normal(size=(100, 2))

def cosine_distance(x1, x2):
    if len(x1.shape) == 1:
        return 1 - np.dot(x1, x2) / (np.linalg.norm(x1) * np.linalg.norm(x2))
    else:
        return 1 - np.sum(np.multiply(x1, x2), axis=1) / (np.linalg.norm(x1, axis=1) * np.linalg.norm(x2, axis=1))

initial_centers = kmeans_plusplus_initializer(X, 8).initialize()
pc_km = kmeans.kmeans(X, initial_centers, metric=distance_metric(type_metric.USER_DEFINED, func=cosine_distance))
pc_km.process()

plt.scatter(X[:, 0], X[:, 1], c=pc_km.predict(X))

reference
-Wrap a part of xmeans of pyclustering like sklearn -How to find the optimal number of clusters for k-means
- Selecting the number of clusters with silhouette analysis on KMeans clustering — scikit-learn 0.22.2 documentation
- pyclustering.cluster.elbow.elbow Class Reference -Clustering G-means that automatically determines the number of clusters
Recommended Posts