[GO] A super beginner who does not know the basics of Python tried to graph the stock price of GAFA
I'm a super beginner who doesn't even know the basics of Python. I tried to graph the stock price of GAFA while googled earnestly. Record the flow up to acquisition as a learning memo.
- Original article → A super beginner who does not know the basics of Python tried to graph the stock price of GAFA [Learning memo]
Python library
To get the stock price and graph it, use the following library.
- Pandas: Data analysis library
- Matplotlib: Graph drawing library
- NumPy: Python extension module
Please check the features of each library from the following articles.
Data analysis library! What is Pandas [For beginners] | Commentary by active engineers Introducing the data analysis (data science) library Pandas, which displays and graphs data statistics.
Graph drawing library! How to use matplotlib [for beginners] Explains in detail how to use matplotlib, a library that can draw graphs in Python.
What is the Python extension module "NumPy"? Install… | Udemy Media NumPy is an extension module that makes machine learning calculations in Python faster and more efficient.
Environment
Google Colaboratory is used as the execution environment for Python.
-
Google Colaboratory A service that allows you to use Jupyter Notebook with the minimum effort and cost, and to start a machine learning project right away with a browser and the Internet.
-
Jupyter Notebook A tool for running Python on a browser and proceeding with programming while recording the execution results.
It is frequently used in data analysis sites and research institutes. By using these services, you can immediately check the execution result of Python on the browser.
Please refer to the following article for details.
- Google Colaboratory Colaboratory (abbreviation: Colab) is a service that allows you to write and execute Python from a browser.
- Indispensable for data analysis! How to use Jupyter Notebook [For beginners] It explains in detail how to use Jupyter Notebook, which is convenient for data analysis using Python for beginners.
I will summarize the flow up to this point.
- A Python library is required to analyze data with Python.
- You can easily proceed with the project using a service called Google Colaboratory.
- With a tool called Jupyter Notebook, you can run Python on a browser and proceed with programming while recording the execution results.
It is good to recognize that. I appologize if I am mistaken.
Get stock price and create graph
Now, let's actually write the code.
For the code, I referred to TF's article. TF has written many articles on asset management using Python. It would be fun if you could use Python so far.
And here is the completed code.
!pip install fix_yahoo_finance

import datetime
import fix_yahoo_finance as yf
import matplotlib.pyplot as plt
%matplotlib inline
import warnings
warnings.filterwarnings('ignore')

start = datetime.date(2020,1,1)
end = datetime.date.today()

codelist = ["GOOGL","AAPL","FB","AMZN","^N225"]
data2 = yf.download(codelist, start=start, end=end)["Adj Close"]

display(data2.head(2).append(data2.tail(2)))
df_all=100*data2.pct_change()
display(df_all[codelist].head(2).append(df_all[codelist].tail(2)))

df_all[codelist].cumsum().plot(figsize=(8,6),fontsize=18)
plt.legend(loc='center left', bbox_to_anchor=(1, 0.5), fontsize=18)

plt.grid(True)
plt.show()
Code description
Install stock price information
!pip install fix_yahoo_finance
We use a library called pandas for data analysis.
Use that pandas to install stock price information from Yahoo Finance.
Import current date
import datetime
#### Import Yahoo Finance information installed with pandas with the name "yf"
import fix_yahoo_finance as yf
#### Import matplotlib pyplot with the name plt
import matplotlib.pyplot as plt
matplotlib : A library used to draw graphs and display images in Python. pyplot : Modules in the matplotlib package.
An interface that implicitly and automatically creates shapes and axes to create the plot you want. Basically, the function of matplotlib is utilized through this module.
#### Description specified when drawing a graph on a notebook with Jupyter Notebook
%matplotlib inline
Jupyter Notebook may display warnings such as unexplained errors. However, it's a warning that has no effect on the result, so hide it.
import warnings
warnings.filterwarnings('ignore')
The execution results up to this point are as follows. I'm getting an error, but it looks like there's no problem.

Substitute the first date of the period you want to get in start
start = datetime.date(2020,1,1)
Substitute today's date for end
end = datetime.date.today()
Assign GAFA name as an array to codelist
codelist = ["GOOGL","AAPL","FB","AMZN","^N225"]
I couldn't figure out the rules for name abbreviations, but it was okay to include the names that appear in tradingview. Also, substitute the Nikkei 225 data for comparison.
Download the stock price information (adjusted closing price) from start to end of the above codelist company in data2
data2 = yf.download(codelist, start=start, end=end)["Adj Close"]
Adj Close : Adjusted closing price
Display the top 2 and bottom 2 of data2 with display
display(data2.head(2).append(data2.tail(2)))
display : Preserve and display the layout of the table in dataframe format head (2) : Top 2 tail (2) : Bottom 2 append : Add element at the end
Calculate the ratio of data change of data2 for 100 times and substitute it for df_all
df_all=100*data2.pct_change()
pct_change : A function that calculates the rate of change (Value of that row-value of previous row) / value of previous row
Example) Today's stock price: 1,100 yen / share Yesterday's stock price: 1,000 yen / share (1,100-1,000) / 1,000 = 10 This means that the stock price has risen by 10%.
Display the top 2 and bottom 2 changes in the codelist (GAFA and Nikkei 225)
display(df_all[codelist].head(2).append(df_all[codelist].tail(2)))
The execution results up to this point are as follows. 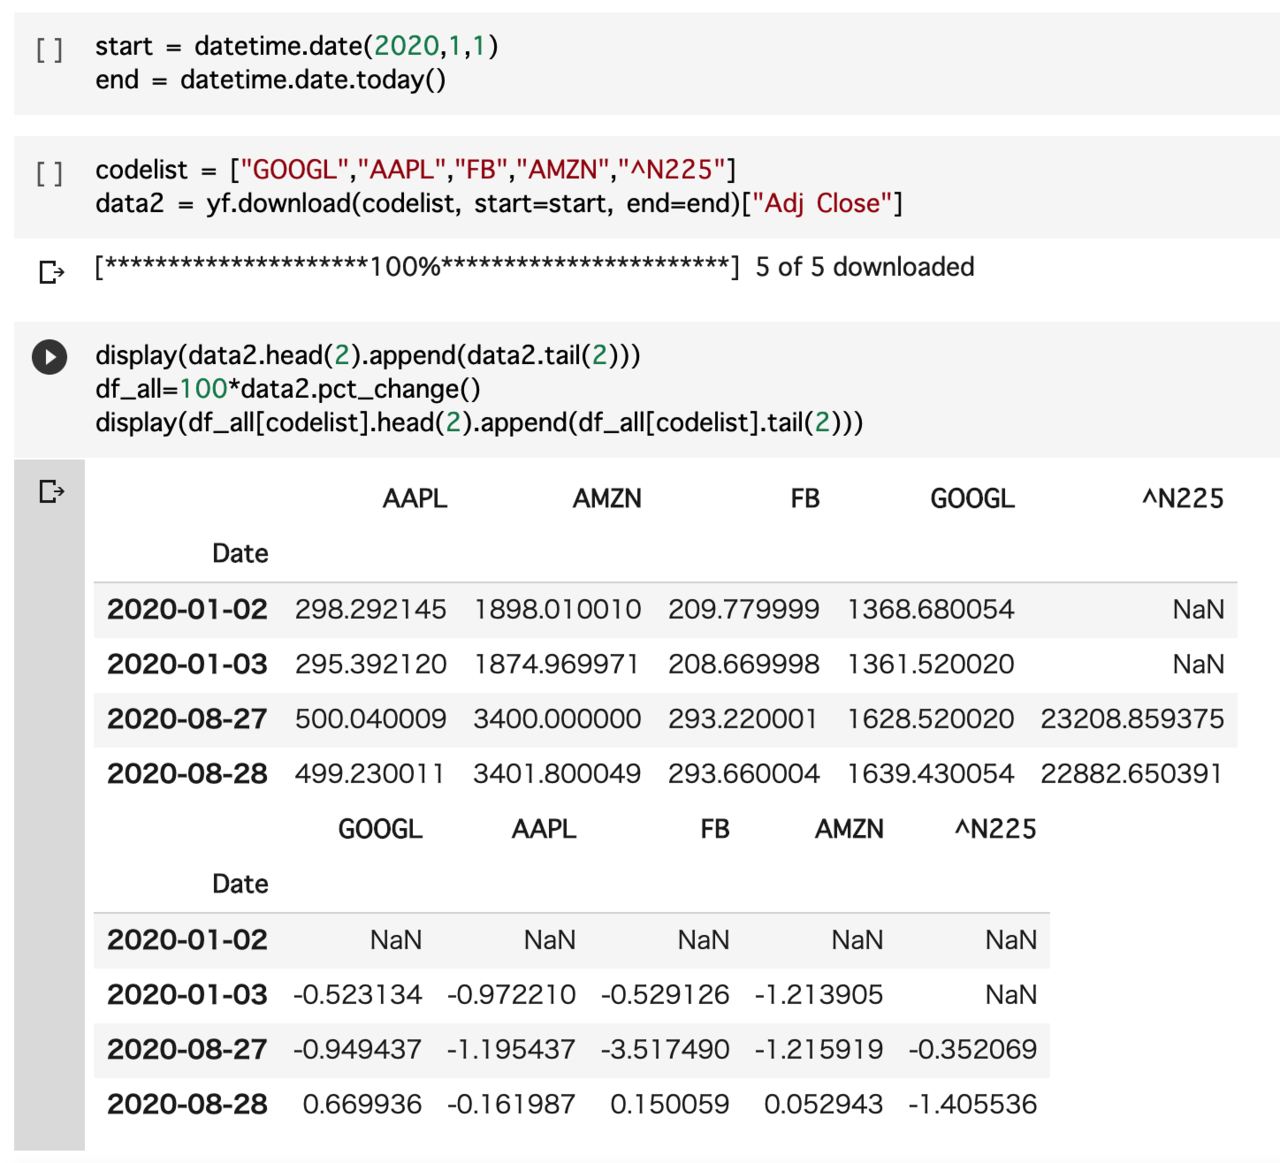 You can see that the top two cases and the bottom two cases of the stock price and the rate of change of the stock price have been acquired.
#### Add up the rate of change of each stock price and output as an array
df_all[codelist].cumsum().plot(figsize=(8,6),fontsize=18)
cumsum () function : NumPy function that outputs the sum of elements as an array plot : matplotlib methods. It is used when drawing a line graph. figsize : Horizontal size and vertical size fontsize : Font size of font case law
The legend is displayed in the vertical center on the right side of the graph
plt.legend(loc='center left', bbox_to_anchor=(1, 0.5), fontsize=18)
plt.legend : Display case law loc: Specify the location of case law center : Vertical position of case law left : Position next to the case bbox_to_anchor : Specify the position of the frame of the graph 1,0.5 : Right edge, vertical center
The execution results up to this point are as follows.

Display the grid on the graph
plt.grid(True)
Display the created graph on the screen
plt.show()
The execution result is as follows. 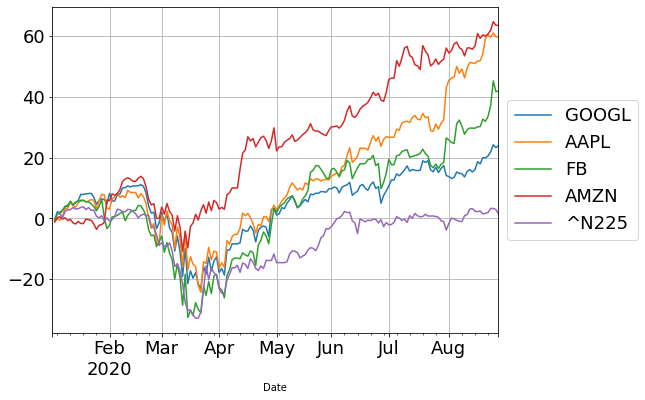 I was able to show the rate of change in stock prices in a grid-like graph.
I've heard that there is nothing that Excel can do that Python can't do, but even though I'm a beginner, it made me feel that possibility.
GAFA is too strong
Now that we have a graph of the stock price, let's take a look at the contents.
GAFA temporarily dropped due to the corona shock, but quickly recovered to pre-corona levels and continues to hit record highs.
I think it's safe to buy one of GAFA without thinking about anything.
The Nikkei average is considerably weaker than GAFA.
However, thanks to all government policies, pre-Corona levels have almost recovered.
Even the weakest Nikkei average has risen nearly 30% from the lowest corona shock. I wanted to prepare a lot during the corona shock.
Summary
- Even a super beginner was able to acquire the stock price of GAFA.
- As I learned while doing it, I naturally gained knowledge.
- US stocks are better than Japanese stocks.
- Even if a crash comes, the government will do something about it, so you can do it.
This time I just got the stock price of GAFA, but I was able to experience the greatness of Python by itself.
It would be fun if you could create your own asset management portfolio with Python.
Recommended Posts