[PYTHON] Interactively visualize data with TreasureData, Pandas and Jupyter.
Introduction
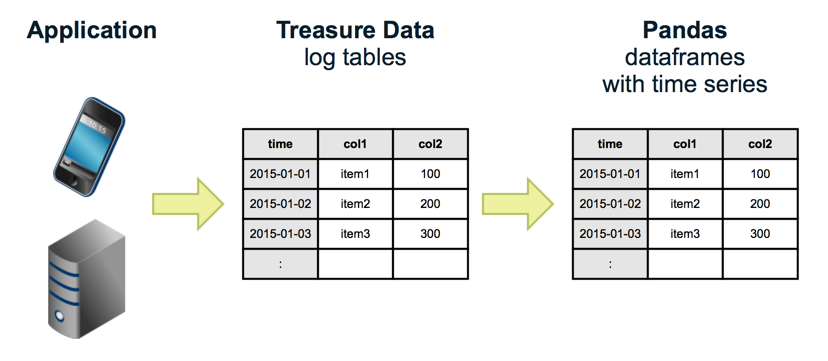
TreasureData is a cloud service that allows you to easily collect, store, and analyze time-series data such as application logs and sensor data. Currently, Presto is available as one of the analysis engines, and the collected data can be analyzed interactively with SQL. became.
However, TreasureData does not have the function of visualizing based on the data analyzed by SQL, so it is necessary to perform visualization using an external tool such as Excel or Tableau.
So this time, we have Pandas, which is a popular Python library, and Jupyter, which allows you to interactively execute Python in a web browser. By using, we will execute SQL interactively with TreasureData for aggregation and visualization.
setup
Usage environment
- Ubuntu 14.04
- Python 3.4
- Pandas
- Jupyterhub
TreasureData
Sign up
Sign up from the here page. Currently, there is a 14-day trial period during which you can use Presto.
Pandas
Pandas is a tool that looks like the following, when quoted from the official.
pandas is an open source, BSD-licensed library providing high-performance, easy-to-use data structures and data analysis tools for the Python programming language.
Python installation
Ubuntu14.04 includes Python3.4, but python3 is an alias and it is troublesome, so we will build the environment with pyenv.
Reference: http://qiita.com/akito1986/items/be5dcd1a502aaf22010b
$ sudo apt-get install git gcc g++ make openssl libssl-dev libbz2-dev libreadline-dev libsqlite3-dev

$ cd /usr/local/
$ sudo git clone git://github.com/yyuu/pyenv.git ./pyenv
$ sudo mkdir -p ./pyenv/versions ./pyenv/shims

$ echo 'export PYENV_ROOT="/usr/local/pyenv"' | sudo tee -a /etc/profile.d/pyenv.sh
$ echo 'export PATH="${PYENV_ROOT}/shims:${PYENV_ROOT}/bin:${PATH}"' | sudo tee -a /etc/profile.d/pyenv.sh
$ source /etc/profile.d/pyenv.sh

$ pyenv -v
pyenv 20150601-1-g4198280

$ sudo visudo
#Defaults       secure_path="/usr/local/sbin:/usr/local/bin:/usr/sbin:/usr/bin:/sbin:/bin"
Defaults    env_keep += "PATH"
Defaults    env_keep += "PYENV_ROOT"

$ sudo pyenv install -v 3.4.3
$ sudo pyenv global 3.4.3
$ sudo pyenv rehash
Install Pandas
$ sudo pip install --upgrade pip
$ sudo pip install pandas
Try using Pandas from the shell
Please refer to 10 Minutes to pandas.
Jupyter
Jupyter was originally an interactive shell of a web browser for Python called IPython, but now it is being renamed and developed with the aim of making it available in any language. In addition, JupyerHub is a server version of Jupyter that allows multiple users to use Jupyter, making it easy to share notebooks created with Jupyter.
Install JupyterHub
$ sudo apt-get install npm nodejs-legacy
$ sudo npm install -g configurable-http-proxy
#Related libraries
$ sudo pip install zmq jsonschema

#Visualization library
$ sudo apt-get build-dep python-matplotlib
$ sudo pip install matplotlib

$ git clone https://github.com/jupyter/jupyterhub.git
$ cd jupyterhub
$ sudo pip install -r requirements.txt
$ sudo pip install .

$ sudo passwd ubuntu

$ jupyterhub
You can now open and access Jupter from your web browser. http://(IP address):8000/
For other detailed settings of JupyterHub, refer to here.
Use Pandas from Jupyter
First, try logging in. Then, the user directory of the logged-in user is displayed. Here, create a working directory for Jupyter and create a notebook to record your work.
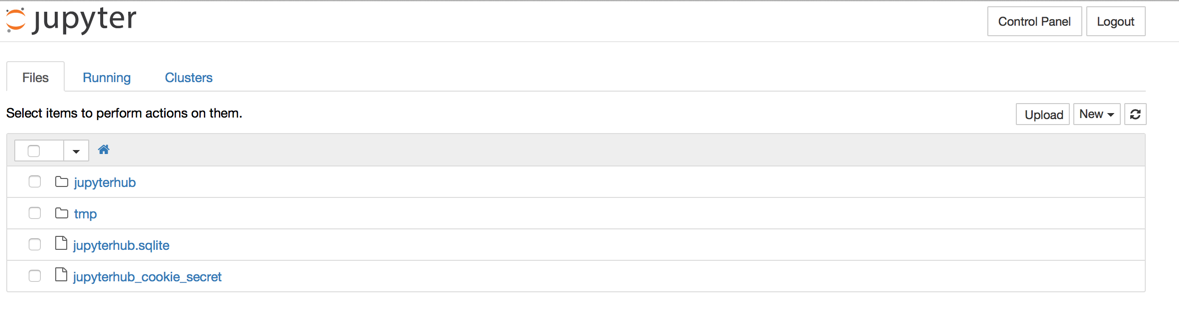
Select New-> Notebooks (Python3).
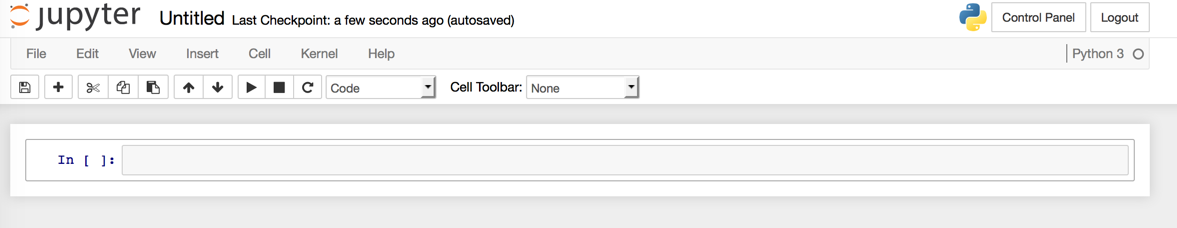
You can save a sequence of Python commands in this Notebook.
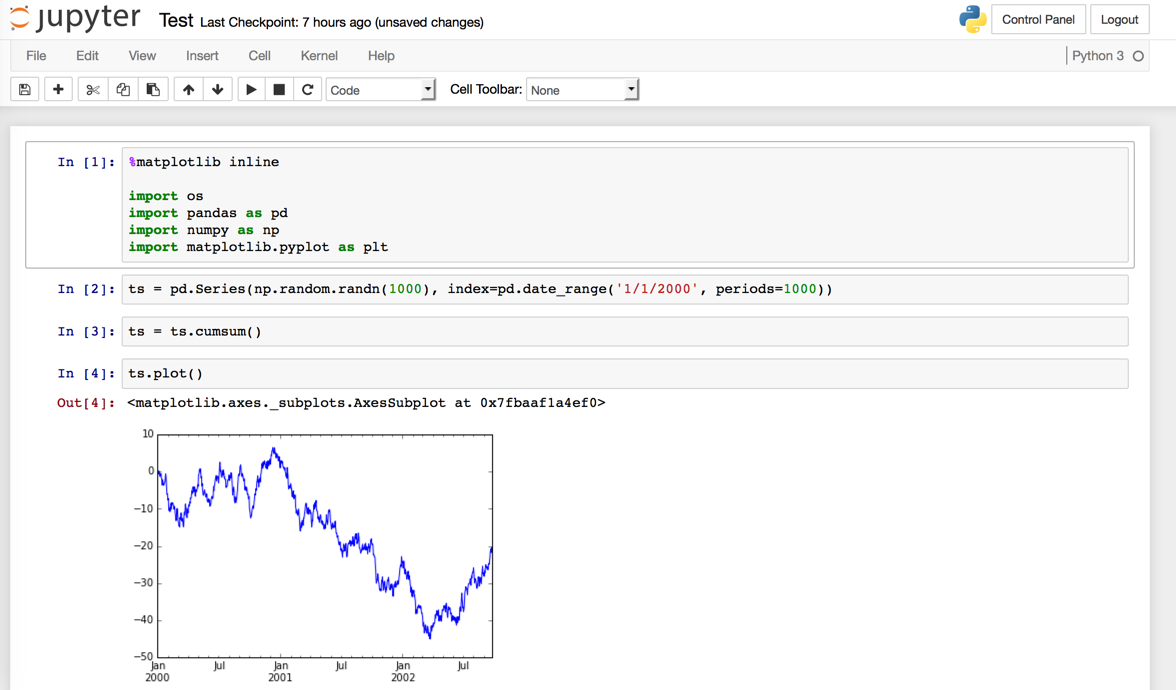
Now, let's test based on here.
%matplotlib inline

import os
import pandas as pd
import numpy as np
import matplotlib.pyplot as plt

ts = pd.Series(np.random.randn(1000), index=pd.date_range('1/1/2000', periods=1000))

ts = ts.cumsum()

ts.plot()
ToDo: It seems that the first import can be omitted with the following config, but it has not been done well yet, so I am checking ...
$ jupyterhub --generate-config
Writing default config to: jupyterhub_config.py

$ vi jupyterhub_config.py
c.IPKernelApp.matplotlib = 'inline'
c.InteractiveShellApp.exec_lines = [
    'import pandas as pd',
    'import numpy as np',
    'import matplotlib.pyplot as plt',
]

$ mv jupyterhub_config.py .ipython/profile_default/
Working with Treasure Data and Pandas using pandas-td
Now that you should be able to use Pandas and Jupyter, I would like to access Treasure Data further.
Here, we will use a library called pandas-td. By using this, you will be able to do three things.
- Put data in the table of TreasureData
- Extract data from the TreasureData table
- Query with TreasureData to get results
Installation
$ sudo pip install pandas-td
Connection settings
%matplotlib inline

import os
import pandas as pd
import pandas_td as td

#It is convenient if you put it in an environment variable
#con = td.connect(apikey="os.environ['TD_API_KEY']", endpoint='https://api.treasuredata.com/')
con = td.connect(apikey="TD API KEY", endpoint='https://api.treasuredata.com/')
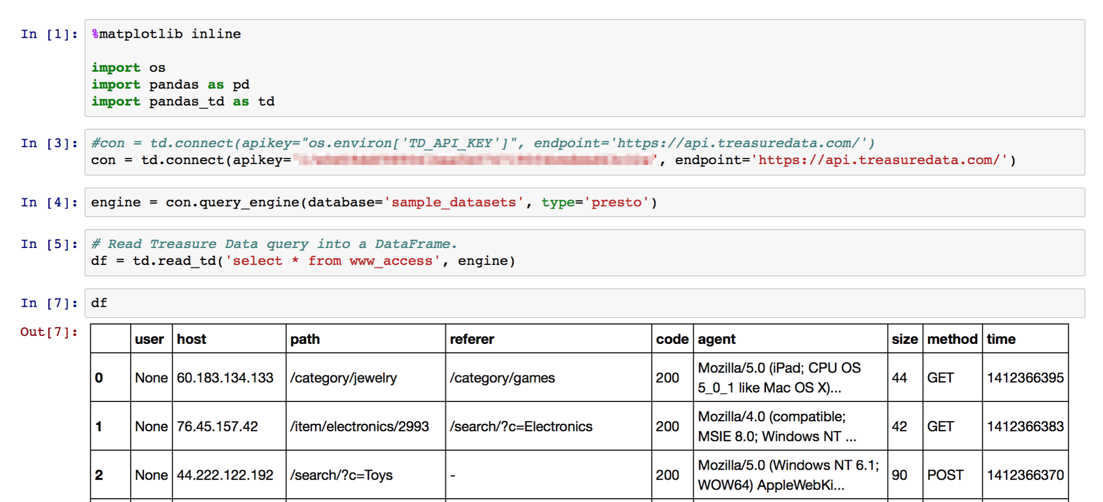
Issue a query
engine = con.query_engine(database='sample_datasets', type='presto')
# Read Treasure Data query into a DataFrame.
df = td.read_td('select * from www_access', engine)
df
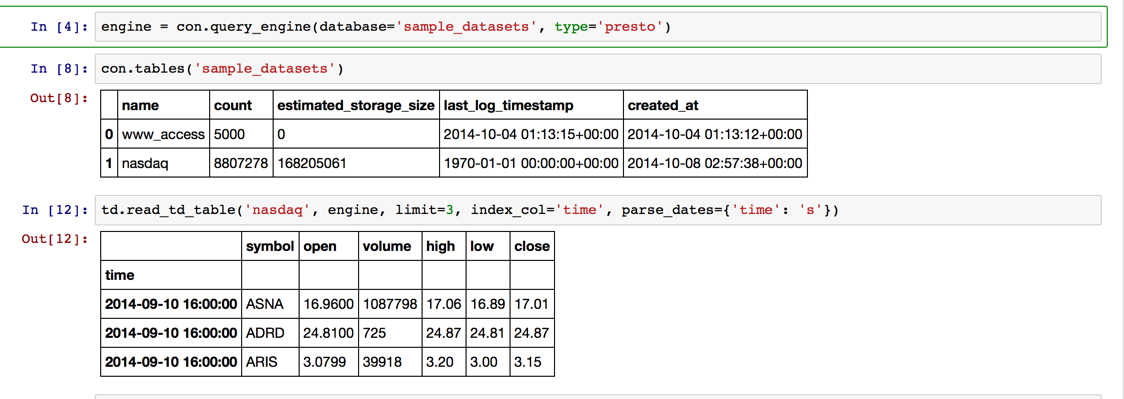
Take a look at some of the data
engine = con.query_engine(database='sample_datasets', type='presto')
con.tables('sample_datasets')
td.read_td_table('nasdaq', engine, limit=3, index_col='time', parse_dates={'time': 's'})
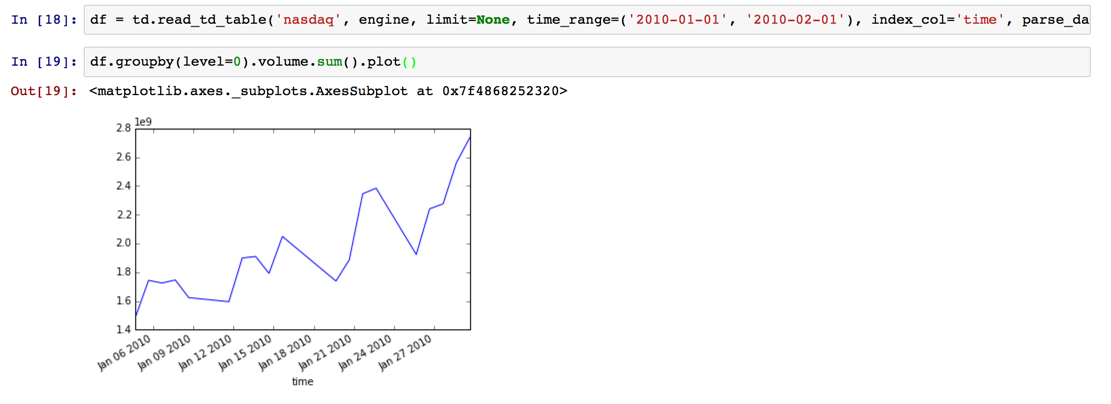
Get by narrowing down the period, aggregate by date, and visualize
df = td.read_td_table('nasdaq', engine, limit=None, time_range=('2010-01-01', '2010-02-01'), index_col='time', parse_dates={'time': 's'})
df.groupby(level=0).volume.sum().plot()
What is convenient
You can easily rewrite the intermediate processing and retry. If it is about several million, it can be processed in memory based on the downloaded result. You can also bring data from MySQL and CSV files.
etc.
in conclusion
I can't deny the feeling of exhaustion on the way, so I'll write more properly soon.
Recommended Posts