[PYTHON] A collection of methods used when aggregating data with pandas
Read CSV file
data = pd.read_csv("sample.csv", encoding="UTF-8")
data
result

Contents of sample.csv
Unnecessary,Unnecessary,Unnecessary,Unnecessary,Unnecessary,Unnecessary
Unnecessary,Title A,Title B,Title C,Title D,Unnecessary
Unnecessary,10,20,30,40,Unnecessary
Unnecessary,100,200,300,400,Unnecessary
Unnecessary,Unnecessary,Unnecessary,Unnecessary,Unnecessary,Unnecessary
I save the data in the Google spreadsheet as CSV and imagine the data when analyzing it. I think there are quite a few sheets where memos and remarks are written without being structured. I think that you can select the range when saving, but this time I will try to organize it with pandas after practicing.
Change the contents of the specified line to the column name
data.columns = data.iloc[0]
data
result

Extract only specified rows / columns
data = data.iloc[1:3,1:5]
data
result
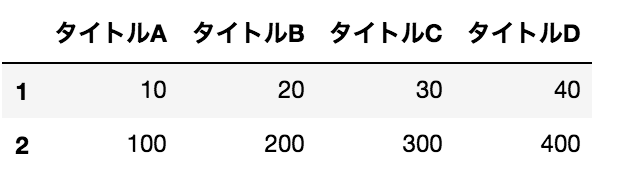 It's just what I want.
Produce various summary statistics (failure)
data.describe()
result
 I thought that the average etc. would come out, but it doesn't.
This is because the value type is not numeric.
I thought that the average etc. would come out, but it doesn't.
This is because the value type is not numeric.
Change the value type
data = data.astype('int')
data
result

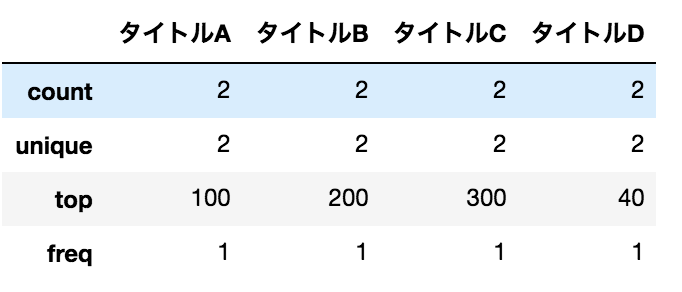
Produce various summary statistics (success)
data.describe()
result

Get the correlation coefficient
data.corr()
result
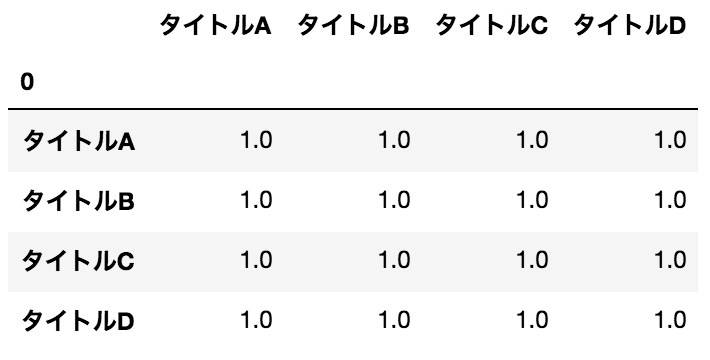 #### Remarks
I don't know what the 0 in the upper left is
#### Remarks
I don't know what the 0 in the upper left is
Various other things
data.sum() #total
data.skew() #skewness
data.kurt() #kurtosis
data.var() #Distributed
data.cov() #Covariance matrix
Remarks
- It was easy to understand about covariance http://mathtrain.jp/covariance
- It was easy to understand about the covariance matrix http://mathtrain.jp/covariance
Display a boxplot
%matplotlib inline #Required to display on page
data.plot(kind='box')
result
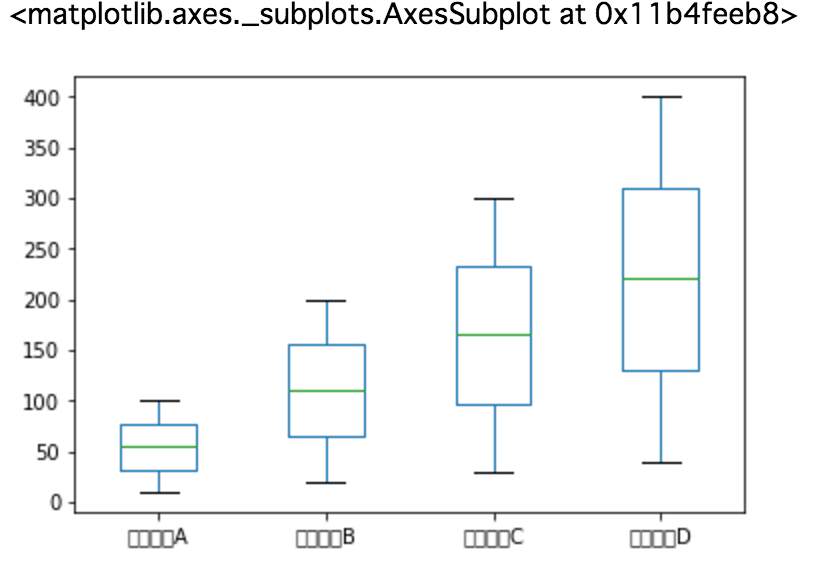 #### Remarks
The Japanese label is not displayed, but Japanese is
```
matplotlib.rcParams['font.family'] = 'M+ 1c' #Specifiable font
```
It can be displayed by specifying as.
The fonts that can be specified are
```
import matplotlib.font_manager as fm
fm.findSystemFonts()
```
You can find out at.
http://qiita.com/hagino3000/items/1b54acc01483ccd0ac72
I referred to.
#### Remarks
The Japanese label is not displayed, but Japanese is
```
matplotlib.rcParams['font.family'] = 'M+ 1c' #Specifiable font
```
It can be displayed by specifying as.
The fonts that can be specified are
```
import matplotlib.font_manager as fm
fm.findSystemFonts()
```
You can find out at.
http://qiita.com/hagino3000/items/1b54acc01483ccd0ac72
I referred to.
DataFrame join (row direction)
pd.concat([data,data])
result

Join DataFrame (column direction)
pd.concat([data,data], axis=1)
result

Change all values
data.pipe(lambda df: df / 2)
result

Sort by value
data['Title A'].sort_values(ascending = True)
result

Recommended Posts