[PYTHON] Summary of scikit-learn data sources that can be used when writing analysis articles
Introduction
This article uses Python 2.7, numpy 1.11, scipy 0.17, scikit-learn 0.18, matplotlib 1.5. It has been confirmed to work on jupyter notebook. Based on Data loading utilities, we have summarized the data sources that can be quickly prepared when writing an article. Some specifications have changed between version 0.18 and earlier. It will be updated sequentially each time the sample data is used.
table of contents
-
loading dataset
- iris
- boston
- diabetes
- digits
- linnerud
-
Generating dataset
- blobs
- make_classification
-
Reference
-
Loading dataset Use Sklearn's Lorder to load pre-prepared sample data. Data loading utilities introduces 5 data as toy datasets. Since the amount of data is not large (around 100 samples), these can be acquired offline. [This article](http://pythondatascience.plavox.info/scikit-learn/scikit-learn%E3%81%AB%E4%BB%98%E5%B1%9E%E3%81%97%E3% 81% A6% E3% 81% 84% E3% 82% 8B% E3% 83% 87% E3% 83% BC% E3% 82% BF% E3% 82% BB% E3% 83% 83% E3% 83% Since it was summarized in quite detail in 88 /), I will only briefly introduce the data.
1.1. iris Get basic iris data with bunch object. (It can be obtained by combining data & label by setting load_iris (return_X_y = True) from ver0.18) Used for classification problems.
load_iris.py
from sklearn.datasets import load_iris
data = load_iris()
print data.target_names
print data.target[:10]
print data.data[:10]
When executed, three label names, data labels, and four-dimensional parameters are obtained. The size is 50 samples for each label. Execution example:
['setosa' 'versicolor' 'virginica']
[0 0 0 0 0 0 0 0 0 0]
[[ 5.1  3.5  1.4  0.2]
 [ 4.9  3.   1.4  0.2]
 [ 4.7  3.2  1.3  0.2]
 [ 4.6  3.1  1.5  0.2]
 [ 5.   3.6  1.4  0.2]
 [ 5.4  3.9  1.7  0.4]
 [ 4.6  3.4  1.4  0.3]
 [ 5.   3.4  1.5  0.2]
 [ 4.4  2.9  1.4  0.2]
 [ 4.9  3.1  1.5  0.1]]
1.2. boston This is a data set of 13 types of information on the outskirts of Boston and housing prices by region. It can be used for regression problems.
| The number of samples | Number of dimensions | Feature | label |
|---|---|---|---|
| 506 | 13 | real x>0 | real 5<y<50 |
Description of parameters (12)
- CRIM: Number of crimes per capita
- Percentage of residential areas over 25,000 square feet
- INDUS: Percentage of non-retail commerce
- CHAS: Dummy variable by the Charles River (1: Around the river, 0: Other)
- NOX: NOx concentration
- RM: Average number of rooms in a residence
- AGE: Percentage of properties built before 1940
- DIS: Distance from 5 Boston Employment Facilities (Weighted)
- RAD: Easy access to the ring road
- TAX: Total Real Estate Tax Rate Per $ 10,000
- PTRATIO: Child-Teacher Ratio by Town
- B: The ratio of blacks (Bk) in each town is expressed by the following formula. 1000 (Bk – 0.63) ^ 2
- LSTAT: Percentage of the population engaged in low-paying occupations (%)
The figure below plots the crime rate per person artificial and the housing prices by region on the outskirts of Boston.

1.3. diabetes Laboratory values of 442 diabetic patients and disease progression one year later. Used for regression problems.
| The number of samples | Number of dimensions | Feature | label |
|---|---|---|---|
| 442 | 10 | real -2>x>2 | int 25<y<346 |
1.4. digits A 10-character handwritten number from 0 to 9 decomposed into 64 (8 x 8) pixels. Used for image recognition.
| The number of samples | Number of dimensions | Feature | label |
|---|---|---|---|
| 1.797 | 64 | int 0<x<16 | int 0<y<9 |
1.5. Linnerud Relationship between three physiological features and three athletic performance measured at a fitness club for 20 adult men, created by Dr. A.C. linnerud of North Carolina State University. Used for multivariate analysis.
| The number of samples | Number of dimensions |
|---|---|
| 20 | Explanatory variable:3,Objective variable:3 |
Contents of explanatory variables
	Chins	Situps	Jumps
0	5	162	60
1	2	110	60
2	12	101	101
3	12	105	37
4	13	155	58
Contents of the objective variable
Weight	Waist	Pulse
0	191	36	50
1	189	37	52
2	193	38	58
3	162	35	62
- Generating dataset Use the Sample generator to generate characteristic data each time. You can generate as much data as you want with specific characteristics.
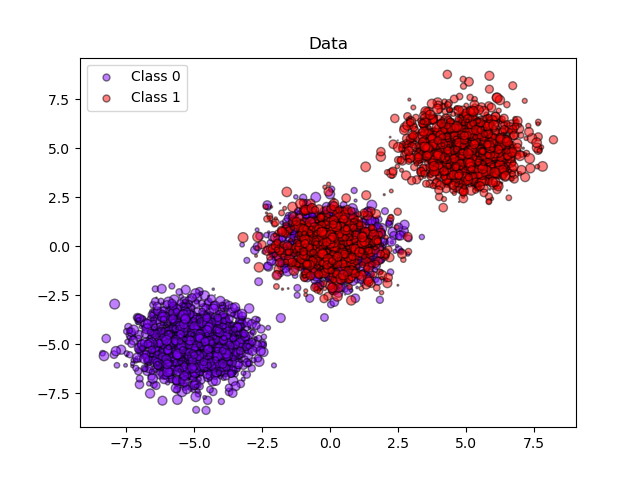
2.1. blobs Generate data that looks like a central stain spread. You can select the number of samples and the number of clusters in n_samples and centers respectively. You can set the number of labels with n_features.
make_blobs.py
from sklearn.datasets.samples_generator import make_blobs
X, y = make_blobs(n_samples=10, centers=3, n_features=2, random_state=0)
print(X.shape)
Execution example:
array([[ 1.12031365,  5.75806083],
       [ 1.7373078 ,  4.42546234],
       [ 2.36833522,  0.04356792],
       [ 0.87305123,  4.71438583],
       [-0.66246781,  2.17571724],
       [ 0.74285061,  1.46351659],
       [-4.07989383,  3.57150086],
       [ 3.54934659,  0.6925054 ],
       [ 2.49913075,  1.23133799],
       [ 1.9263585 ,  4.15243012]])
In Sample, 3 data sets are generated in 2 classes. are doing.
(Before version 0.18, train_test_split gives an error)
2.2. make_classification When you want to deal with classification problems, you can generate multidimensional data and labels for each. There was a detailed explanation on this site. Basically, by adjusting n_features, n_classes, and n_informative, it is possible to generate data that includes correlations.
| Parameter name | Description | Default |
|---|---|---|
| n_features | Number of dimensions of data to be generated | 20 |
| n_classes | Number of labels | 2 |
| n_informative | Number of normal distributions used in the data generation process | 2 |
| n_cluster_per_class | Number of normal distributions in each label | 2 |
make_classification.py
from sklearn.datasets import make_classification
import matplotlib.pyplot as plt
%matplotlib inline

X1, Y1 = make_classification(n_samples=1000, n_features=2, n_redundant=0, n_informative=2,n_clusters_per_class=2, n_classes=2)
plt.scatter(X1[:, 0], X1[:, 1], marker='o', c=Y1)
Execution example:
(The plot changes from run to run because it is randomly selected from Informative features and Redundunt fetures.)

scikit-learn example
There was an easy-to-understand example. Please also refer to.
reference
Data loading utilities blobs make_classification Sample data generation using scikit-learn
Recommended Posts