[PYTHON] Summary of situations where plotly express can be used [When can you use it from matplotlib? ]
Introduction
Speaking of drawing graphs, matplotlib + serborn is the major one. Beyond these ** Plotly express has the potential to create interactive graphs. ** ** I would like to focus on the points where plotly express is more convenient than matplotlib + seaborn.
plotly express, I have the impression that there is not much habit. ** Graphs can be plotted with fewer lines than plotly, and those who have used matplotlib should be able to introduce it without much discomfort. ** **
The scene where ** plotly express is useful ** that I personally think is like this. ――I wrote a histogram, but the hem is too wide on the right, so I don't really understand ... However, it's awkward to write a graph with only the right hem enlarged. ――I want to make a stacked bar graph, but the few ones are crushed. In the first place, the graphs piled up with seaborn are troublesome. ――I want to check the data that is out of alignment in the scatter plot, but it is troublesome to find out which data is out of alignment. ――I made a pair plot, but there are too many explanatory variables ... Is there a way to check which explanatory variables are important in one shot? ――I want to know the time and value when an error occurs in the time series data.
What to do in this article
Let's plot a convenient graph compared to seaborn We will use titanic data, yearly passenger number data, and wine grade data from the python dataset as analysis data.
** With titanic data --Histogram --Stacked bar graph --Box plot With airplane passenger number data
- Line graph With wine grade data
- Scatter plot --Parallel coordinates **
I've also included links to the actual html files for these graphs. From the html link, you can experience the feeling of actually moving around. It feels good. For example, this graph. https://nakanakana12.github.io/plotly/hello_world/histgram.html
This article is insanely detailed on how to draw various graphs. Summary of basic drawing method of Plotly Express, the de facto standard of Python drawing library in the Reiwa era https://qiita.com/hanon/items/d8cbe25aa8f3a9347b0b
Library import
python
import pandas as pd
import numpy as np
import matplotlib.pyplot as plt
import seaborn as sns
import plotly.express as px
from sklearn.datasets import load_wine
titanic data
python
df = pd.read_csv('http://biostat.mc.vanderbilt.edu/wiki/pub/Main/DataSets/titanic3.csv')
#Added a column with rounded ages every 10 years
df["age10"] = df["age"] // 10 * 10
df["survived_num"] = df["survived"]
df["survived"] = df["survived"].replace(1,"alive").replace(0,"dead")
df["sex_num"] = df["sex"].replace("female",1).replace("male",0)
df = df.reset_index()
df.head()

histogram
** Plotly is useful for distributions with a long hem to the right! ** **
Shows a histogram of fares. Color-coded according to whether they survived. Fares are not normally distributed, but ** have a long hem on the right side **. In such a case, matplotlib makes it difficult to see a small number of data, which is quite a problem.
With plotly, you can magnify a small area, so it's easy to grasp the situation.
In this case, the number of people with high fares is small, but the survival rate is high, just by going through one graph.
python
fig = px.histogram(df, x="fare", color="survived",nbins=200, opacity=0.4, marginal="box"
                  , title="Histogram of fares by Survived")
fig.update_layout(barmode='overlay')
fig.show()

#Save as html
fig.write_html('./histogram.html', auto_open=False)

Click here for the html file. You can move it. https://nakanakana12.github.io/plotly/hello_world/histgram.html
Stacked bar graph
** With plotly express, stacked bar graphs are easy and easy to see! ** **
This may be the best recommendation.
The problem with creating a stacked bar graph is when there are many classifications. Sometimes I don't know the number of things that are few. With plotly, it is convenient to be able to check the number by hovering over it even if the number is small.
Here, we visualized whether or not we survived by age. Also, I tried to make a case where the gender is displayed together and a case where the graph is separated. It is well visualized that the survival rate is low after the 50s and that the survival rate is higher for women.
python
#Preprocessing
df_bar = df.groupby(["survived", "age10","sex"],as_index=False).size().reset_index(drop=True)
df_bar.columns = ["survived", "age10","sex","count"]
df_bar.head()

python
fig = px.bar(df_bar, y="age10", x="count", orientation="h",color="survived"
            , title="Survived by age(Display all together)")
fig.show()
 Click here for the html file.
https://nakanakana12.github.io/plotly/hello_world/bar.html
Click here for the html file.
https://nakanakana12.github.io/plotly/hello_world/bar.html
python
fig = px.bar(df_bar, y="age10", x="count", orientation="h",facet_row="sex",color="survived"
            , title="Survived by age")
fig.show()

Click here for the html file. https://nakanakana12.github.io/plotly/hello_world/bar3.html
Box plot
** Easy to check outliers! ** **
For boxplots, it is convenient to be able to easily see outliers and confidence interval data.
Also, I personally find it convenient to specify hover_data as the index. This makes it easy to see the index of outliers and the data in other columns right away.
python
fig = px.box(df, x="pclass", y="age", color="survived", hover_data=["index"])
fig.show()

#Save as html
fig.write_html('./box.html', auto_open=False)

Click here for the html file. https://nakanakana12.github.io/plotly/hello_world/box.html
Airplane passenger data
Line graph
** Easy to know the time and value of abnormal values! ** **
Line graphs are a standard for time-series data. Let's plot the transition for each month from the passenger number data.
You can select the graph to display by clicking the legend, or you can select the display section with the slider below. You can also check the x-axis and y-axis of the points you care about with the mouse.
To be honest, this data does not benefit, but it seems to be useful when there are many categories or when you want to check the x-axis of outliers.
python
df = sns.load_dataset("flights")
fig = px.line(df, x="year", y="passengers", color="month", title="Changes in the number of passengers")
fig.update_layout(xaxis_range=['1949-01-01', '1961-01-01'], # datetime.May be specified by datetime
                 xaxis_rangeslider_visible=True)
fig.show()
#Save as html
fig.write_html('./time_series.html', auto_open=False)

Click here for the html file. https://nakanakana12.github.io/plotly/hello_world/time_series.html
Wine grade data
Data preparation
python
data_wine = load_wine()
df = pd.DataFrame(data_wine["data"], columns=data_wine["feature_names"])
df["target_ID"] = data_wine["target"]
df["target"] = df["target_ID"].replace(0,"bad").replace(1,"good").replace(2,"great")

df["alcohol_rank"] = np.where(df["alcohol"] < df["alcohol"].mean(),"low", "high")
df["flavanoids_rank"] = np.where(df["flavanoids"] < df["flavanoids"].mean(),"low", "high")

df = df.reset_index()
df.head()

Scatter plot
** You can easily find the index of the data you care about! ** **
It is convenient to hover the mouse over the scatter plot so that you can easily check which data are outliers.
My personal recommendation is to specify index for hover_data. If you do this, you can find the index of the outlier data just by hovering the mouse, and you can easily check other values.
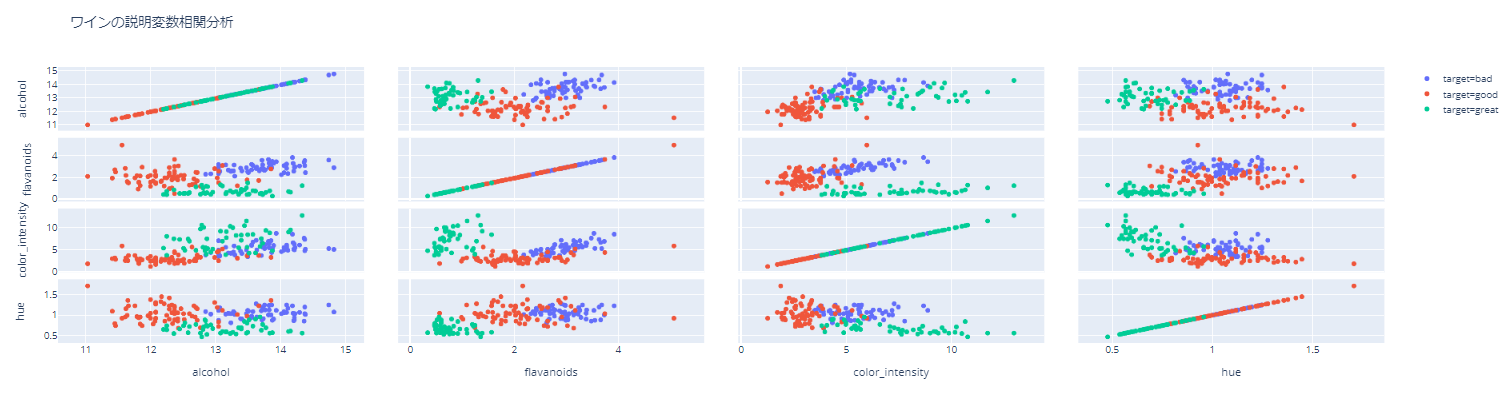
It's pretty easy to do things like seaborn pair plots.
python
fig = px.scatter(df, x="alcohol", y="color_intensity", color="target",
                 marginal_x="box", marginal_y="histogram", trendline="ols",
                 hover_data=["index"],
                title="Relationship between alcohol content and color intensity of wine")
fig.show()

#Save as html
fig.write_html('./scatter.html', auto_open=False)

Click here for the html file. https://nakanakana12.github.io/plotly/hello_world/scatter.html
python
fig = px.scatter_matrix(df, dimensions=["alcohol", "flavanoids","color_intensity","hue"],color="target",
hover_data=["index"],
title="Explanatory variable correlation analysis of wine")
fig.show()
#Save as html
fig.write_html('./scatter2.html', auto_open=False)
Click here for the html file. https://nakanakana12.github.io/plotly/hello_world/scatter2.html
Parallel coordinates
** Easy to check the correlation for each variable! !! ** **
This can be insanely useful when there are many explanatory variables.
Looking at this figure, it is obvious that the target_ID increases when flavonoids and hue are small and when color_intensity is large. I feel that the correlation of other variables is also fairly easy to understand.
It can also be used for categorized variables.
python
fig = px.parallel_coordinates(df, dimensions=["alcohol","flavanoids", "color_intensity","hue"],color="target_ID")
fig.show()

#Save as html
fig.write_html('./parallel.html', auto_open=False)

Click here for the html file. https://nakanakana12.github.io/plotly/hello_world/parallel.html
python
#For categorical variables
fig = px.parallel_categories(df, dimensions=["alcohol_rank","flavanoids_rank","target"],color="target_ID")
fig.show()

#Save as html
fig.write_html('./parallel_cat.html', auto_open=False)

Click here for the html file. https://nakanakana12.github.io/plotly/hello_world/parallel_cat.html
At the end
I knew plotly itself, but I had a habit of using it and gave up learning. Compared to that, ** plotly express feels pretty easy to get started with. ** ** It's really convenient when you need to check outliers.
I would like to challenge 3D visualization and animation someday.
Until the end Thank you for reading. If you find it helpful, it would be encouraging if you could use LGTM.
Recommended Posts