[PYTHON] Graph display of household power consumption with 3GPI and Raspberry Pi
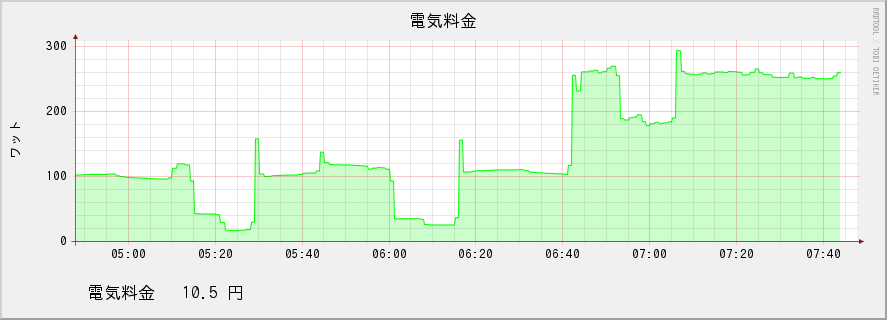
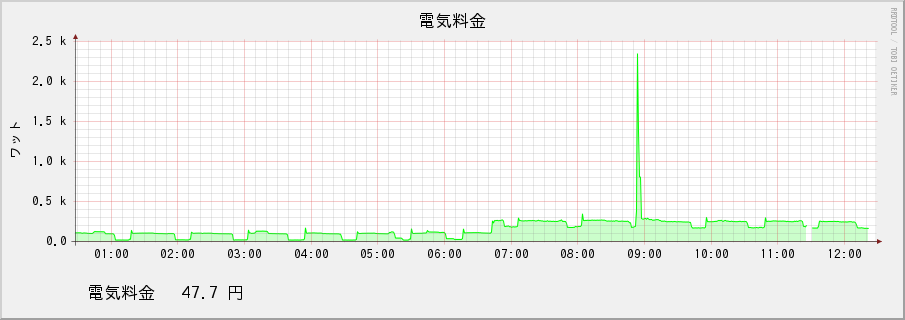
Attach the sensor to the distribution board at home and make a graph like this.
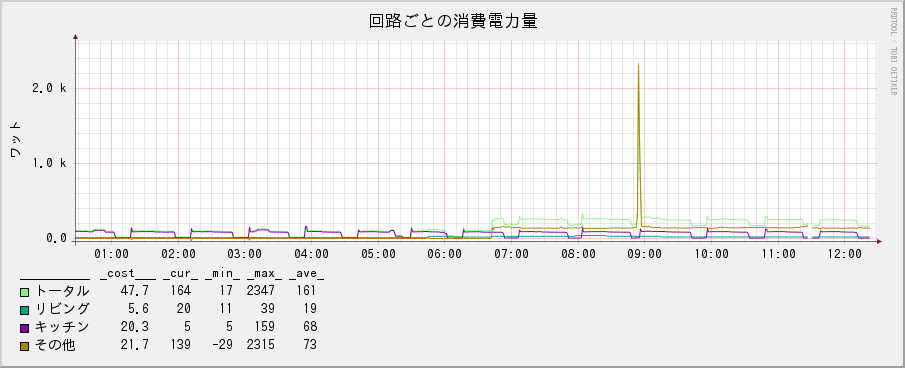
Also the power consumption of each circuit.

Introduction
I wanted to know the power consumption of my home. If there is unnecessary standby power, I would like to reduce it, and if there is a device that wastes electricity, I would like to replace it with a low power consumption product. If you use a smart meter, you can see the transition of total power consumption, but you cannot know the consumption of each circuit branched from the distribution board. I would like to display the power consumption of each circuit as a graph.
The unit price of electricity has been decided to be 25 yen / kWh based on the results of my home in 2015.
spec
- Install a current sensor on the distribution board
- Monitor total power consumption and branch circuit power consumption
- Powered by Raspberry Pi from a wall outlet
- Supports single-phase three-wire and single-phase two-wire
- Estimate power consumption only by measuring current (do not measure voltage)
- Maximum current is 60A
- 3G communication
- Send to log server every 300 seconds
- I want to see the transition graph in the browser
- I want to handle strange waveforms. SSR, switching power supply, low power factor equipment, etc.
- Supports 50 and 60Hz
- Minimal electronic work and processing
- Restart the system when the program stops
Calculation method of power consumption
Power consumption = voltage x current x time Determined to voltage = 100 V Current = Root Mean Square of the measured value (https://en.wikipedia.org/wiki/%E4%BA%8C%E4%B9%97%E5%B9%B3%E5%9D%87%E5% Use B9% B3% E6% 96% B9% E6% A0% B9) Time = Accumulate the measured values at each time
Current measurement method
The measurement method was to connect the output of the current sensor to the AD converter without going through a smoothing circuit or rectifier circuit. We expect that the waveform can be read if there is sufficient sampling speed.
I thought that the sampling speed should be about 5 samples per half cycle. In order to support the power frequency of 50Hz and 60Hz, I would like to have about 600 samples per second.
design
Overview of the system (image at the beginning of development)

Hardware design
Buy equipment It was 57,390 yen in total. For the power supply, USB cable, universal board, pin header, pin socket, and cables, I used the surplus at home.
| Things necessary | What i bought | shop | Amount of money |
|---|---|---|---|
| 3G communication module | 3GPI | Switch science | 29,800 yen |
| Power management module | slee-Pi | Switch science | 11,800 yen |
| Raspberry pi | Raspberry Pi 2 Model B | Switch science | 5,940 yen |
| WiFi dongle | GW-USNANO2A | Switch science | 1,350 yen |
| 4 current sensors | SR-3702-150N/14Z | Akizuki Denshi | 3,920 yen |
| 1 AD converter | ADC1015 module | Akizuki Denshi | 1,280 yen |
| 4 metal film resistors | 100Ω 100 pieces | Akizuki Denshi | 300 yen |
| SIM for communication | So-net 0 sim | Sonnet | 3,000 Yen |
Since it is a combination of module parts, difficult circuit design and adjustment are not required. The current-voltage conversion board is made of a universal board.
software
Since there are many libraries, we will use Python as much as possible. I'm looking forward to using Python for the first time.
The server for data management and display uses Sakura Rental Server Standard. For the data management library, try using RRDtool, which has a graph output function. On the server I rented, it was installed under the name rrdtool-fix.
I will make more and more
- Current sensor
- Cable connector
- AD converter
- Raspberry Pi
- 3GPI
- Measured value transmission / reception program
- Graph display program
Current sensor
Solder it to the LAN cable and install it on the distribution board.
 Installed in the main circuit
The distribution board receives power on three lines: red, black, and white. I installed four sensors as follows.
--Sensor 0: Main black line --Sensor 1: Main red line --Sensor 2: Living lighting, living outlet (black) --Sensor 3: Refrigerator, home bakery (red)
According to the Spec Sheet (URD) of a similar sensor that is a product of another company, voltage conversion with a resistor of 10Ω Then 60A is converted to 0.2V. The conversion function is "current = voltage * 300". This does not measure low current, but it seems that 1-60 A can be measured without distortion. When voltage conversion is done with a resistor of 100Ω, 60A is converted to 2.0V. The conversion function is "current = voltage * 30". It seems that it can be measured from about 0.1 A.
I'm at a loss, but the peak can be distorted a little, so I set it to 100Ω, which can read low current.
Although it is a part that is actually used, I purchased a resistor with an error of ± 1%. I measured the resistance value with a tester and used four with the same resistance value close to 100 Ω.
AD converter
Design and build the circuit.

just made it. VDD was set to 3.3V.

The AD converter module has a power supply voltage of 2-5V and I2C speeds from 10kHz to 400kHz as well as 3.4MHz. The I2C Address can be changed from 0x48 to 0x4B at the destination of the ADDR pin. It has a built-in amplifier, can measure negative potential, and can control the gain with a microcomputer. The following 6 ranges.
- ± 0.256 V (125 uV per bit)
- ± 0.512 V (250 uV per bit)
- ± 1.024 V (500 uV per bit)
- ± 2.048 V (1 mV per bit)
- ± 4.096 V (2 mV per bit)
- ± 6.144 V (3 mV per bit)
Using the ± 2.048 V range (x2) on the PGA, the current read by the current sensor is ± 61.44 A. I will try it in the ± 2.048V range. Negative input is possible, which is too convenient. The minimum resolution is 1 mV, which translates to 30 mA in terms of current. The power consumption is 100V x 30 mA = 3 W.
Raspberry pi
No GUI is required for measurement purposes. I'm a console addict, so I'll set it up over the network. I'm looking forward to touching Raspberry Pi for the first time.
Installation
I burned Raspbian Jessie Lite (2016-05-27) on the remaining SD card (16GB microSDHC Class4). Just connect the AD converter board you made and the LAN cable, guess the DHCP address, and log in with SSH. It was too easy to beat. Below is the installation method.
-
Various settings with raspi-config Partition extension, password setting, locale (ja_JP.EUC-JP, added ja_JP.UTF-8, mainly ja_JP.UTF-8), time zone, host name, GPU memory allocation (16MB), I2C enabled respectively Set.
-
Other settings with commands Enter the following command.
#Turn off wireless LAN power management
sudo sh -c "echo options 8192cu rtw_power_mgnt=0 rtw_enusbss=1 rtw_ips_mode=1 > /etc/modprobe.d/8192cu.conf"

#Extend SSH timeout
sudo sh -c "echo ClientAliveInterval 60 >> /etc/ssh/sshd_config"
sudo sh -c "echo ClientAliveCountMax 3 >> /etc/ssh/sshd_config"

#Package update
sudo apt-get update
sudo apt-get upgrade

# i2c-install tools
sudo apt-get install i2c-tools

#Increase i2c clock rate
sudo sh -c "echo dtparam=i2c_baudrate=300000 >> /boot/config.txt"

#i2c check(If 0x48 responds, ADS1015 responds)
i2cdetect -y 1

#Install ADS1015 library
sudo apt-get install git build-essential python-dev
git clone https://github.com/adafruit/Adafruit_Python_ADS1x15.git
cd Adafruit_Python_ADS1x15
sudo python setup.py install
sudo shutdown -h now
3GPI installation
Unplug the power when the Raspberry Pi stops. Connect the 3GPI to the Raspberry Pi and connect the power supply that came with the 3GPI.
More information on 3GPI can be found here [http://mechatrax.github.io/) and GitHub.

3GPI installation
sudo bash -c 'echo "deb http://mechatrax.github.io/3gpi ./" > /etc/apt/sources.list.d/3gpi.list'
sudo apt-get update
sudo apt-get install 3gpi-archive-keyring
sudo apt-get install 3gpi-utils 3gpi-network-manager
sudo reboot
Set the APN. SIM used so-net 0sim. It seems that it is better to delete the APN information that is not used.
APN setting
sudo nmcli con add type gsm ifname "*" con-name so-net apn so-net.jp user nuro password nuro
sudo nmcli c delete gsm-3gpi-iij
sudo nmcli c delete gsm-3gpi-soracom
sudo reboot
With just this, I was able to make a 3G connection. It's a moving thing. Slow ping is also evidence of a 3G connection. I'm happy!
Via 3G line
$ ping google.com -c 4
PING google.com (172.217.25.238) 56(84) bytes of data.
64 bytes from nrt12s14-in-f14.1e100.net (172.217.25.238): icmp_seq=1 ttl=50 time=377 ms
64 bytes from nrt12s14-in-f14.1e100.net (172.217.25.238): icmp_seq=2 ttl=50 time=386 ms
64 bytes from nrt12s14-in-f14.1e100.net (172.217.25.238): icmp_seq=3 ttl=50 time=366 ms
64 bytes from nrt12s14-in-f14.1e100.net (172.217.25.238): icmp_seq=4 ttl=50 time=404 ms

--- google.com ping statistics ---
4 packets transmitted, 4 received, 0% packet loss, time 3003ms
rtt min/avg/max/mdev = 366.570/383.838/404.300/13.866 ms
Via optical line
$ ping google.com
PING google.com (172.217.25.238) 56(84) bytes of data.
64 bytes from nrt12s14-in-f14.1e100.net (172.217.25.238): icmp_seq=1 ttl=53 time=8.01 ms
64 bytes from nrt12s14-in-f14.1e100.net (172.217.25.238): icmp_seq=2 ttl=53 time=9.52 ms
64 bytes from nrt12s14-in-f14.1e100.net (172.217.25.238): icmp_seq=3 ttl=53 time=9.50 ms
64 bytes from nrt12s14-in-f14.1e100.net (172.217.25.238): icmp_seq=4 ttl=53 time=9.66 ms
64 bytes from nrt12s14-in-f14.1e100.net (172.217.25.238): icmp_seq=5 ttl=53 time=9.47 ms
^C
--- google.com ping statistics ---
5 packets transmitted, 5 received, 0% packet loss, time 4005ms
rtt min/avg/max/mdev = 8.017/9.238/9.668/0.614 ms
Measurement and transmission program
Calculate a guideline for traffic. This program sends the power consumption per minute. One message expresses the time stamp and the power consumption of 4 channels in ASCII text, and the size of the message is about 50 bytes. After accumulating 5 minutes of information, bz2 compressed and sent. Since it can be compressed in half, the amount actually transmitted is about 120 bytes, so it is about 3.2 bps.
Considering the overheads of TCP / IP, HTTP, and SSL, it's hard to say without actually communicating.
0sim of so-net is free of communication charges up to 500Mbyte per month. Converted to 1493 bps per second.
If there is a lot of traffic, extend the transmission interval to handle it.
Point to the 3GPI and AD converter board on the Raspberry Pi and write the program.
sudo mkdir -p /opt/whmonitor/bin/
sudo vi /opt/whmonitor/bin/whmonitor.py
sudo chmod +x /opt/whmonitor/bin/whmonitor.py
/opt/whmonitor/bin/whmonitor.py
#!/usr/bin/python
# -*- coding: utf-8 -*-

import time
import math
from collections import deque
import copy
import sys
import datetime
import urllib
import urllib2
import bz2
import Adafruit_ADS1x15
import RPi.GPIO as GPIO


#Related constants for power measurement
MEASURE_INTERVAL = 60
CHANNEL_CHANGE_INTERVAL = 10
CONVERSION_CONSTANT = 30 # 100 ohm
VOLTAGE = 100
TO_KILOWATT = 0.001

#Heartbeat related constants( slee-For Pi)
FLIP_INTERVAL = 500
HEARTBEAT_GPIO = 5

#ADC1015 related constants
I2C_BUSNUM = 1
ADS1015_I2C_BASE_ADDRESS = 0x48
SENSORS = 4
PGA_GAIN = 2
SAMPLING_RATE = 3300

#Data transmission related constants
MINIMUM_UPLOAD_QUEUE_LENGTH = 5
UPLOAD_URL = "https://[Data receiving server host name]/whupdate.cgi"
BASICAUTH_ID = "[Basic authentication ID]"
BASICAUTH_PASS = "[Basic authentication password]"
COMPRESSION_LEVEL = 9


class Recorder:
    """This class uploads data to a web server.
It has a queue inside and records()Holds the list received by the method.
When the queue is long enough, it sends the data to the web server.
If the transmission fails, the transmission will be attempted at the next recording timing.
    """

    def __init__(self, url, ba_id, ba_pass, minimum_upload_queue_length = 1):
        self.data_queue = deque()

        self.url = url
        self.ba_id = ba_id
        self.ba_pass = ba_pass
        self.compression_level = COMPRESSION_LEVEL
        self.minimum_upload_queue_length = minimum_upload_queue_length


    def record(self, data):
        self.data_queue.append(self.__build_message(data))
        tmp_queue=copy.deepcopy(self.data_queue)

        try:
            if self.minimum_upload_queue_length <= len(tmp_queue) :
                self.__send_queue(tmp_queue)
                for dummy in tmp_queue:
                    self.data_queue.popleft()
        except:
            print("===The data could not be sent.===")
            d=datetime.datetime.today()
            print d.strftime("%Y-%m-%d %H:%M:%S"),'\n'


    def __send_queue(self, queue):
        send_string = ""
        for data in queue:
            send_string += " " + data
        response=self.__send_string(send_string)


    def __send_string(self, message):

        pswd_mgr = urllib2.HTTPPasswordMgrWithDefaultRealm()
        pswd_mgr.add_password(None, self.url, self.ba_id, self.ba_pass)
        opener = urllib2.build_opener(urllib2.HTTPSHandler(),
            urllib2.HTTPBasicAuthHandler(pswd_mgr))
        urllib2.install_opener(opener)

        request = urllib2.Request(self.url)
        request.add_data(bz2.compress(message,self.compression_level))

        response = urllib2.urlopen(request)
        return response.read()


    def __build_message(self, data):
        message = str(int(time.time()))
        for value in data:
            message += ":" + str(value)
        return message


class Knocker:
    """This class changes the output voltage of GPIO.
    flip()Flip the output of the specified GPIO pin each time the method is called.
    """

    def __init__(self, port):
        self.port = port
        GPIO.setwarnings(False)
        GPIO.setmode(GPIO.BCM)
        GPIO.setup(port,GPIO.OUT)


    def flip(self):
        GPIO.output(self.port,(GPIO.input(self.port)+1)%2)


class IntervalTimer(object):
    """This class is busyloop at full speed()Execute the method.
Also, longloop every second specified in the constructor()Execute the method
    """

    def __init__(self, interval = 1):
        self.interval = interval

    def busyloop(self):
        pass

    def longloop(self):
        print time.time()-self.start

    def loop(self):
        self.start=int(time.time())
        prev=self.start
        while True:
            while time.time()-prev < self.interval:
                self.busyloop()
            prev = int(time.time())
            self.longloop()


class Sampler(IntervalTimer):

    """This class is the main class.
It manages AD converters, data transmission, and heartbeat management.
    """

    def __init__(self,interval):
        super(Sampler, self).__init__(interval)
        self.knocker = Knocker(HEARTBEAT_GPIO)
        self.recorder = Recorder(UPLOAD_URL, BASICAUTH_ID, BASICAUTH_PASS, \
            MINIMUM_UPLOAD_QUEUE_LENGTH)
        self.adc = Adafruit_ADS1x15.ADS1015(\
            address=ADS1015_I2C_BASE_ADDRESS,busnum=I2C_BUSNUM)
        self.reset_valiables()


    def reset_valiables(self):
        self.sensor = 0
        self.samples = 0
        self.sample_buffer = [0]*SENSORS
        self.sample_length = [0]*SENSORS
        self.watt = [0]*SENSORS


    def busyloop(self):
        if self.samples%CHANNEL_CHANGE_INTERVAL == 0 :
            self.sensor=(self.samples/CHANNEL_CHANGE_INTERVAL)%SENSORS
            self.adc.start_adc(self.sensor, gain=PGA_GAIN, \
                data_rate=SAMPLING_RATE)
            time.sleep(2.0/SAMPLING_RATE)

        current=self.adc.get_last_result()*CONVERSION_CONSTANT

        self.sample_buffer[self.sensor] += current * current
        self.sample_length[self.sensor] += 1
        if self.samples%FLIP_INTERVAL == 0:
            self.knocker.flip()
        self.samples += 1


    def longloop(self):
        for self.sensor in range(SENSORS):
            if self.sample_length[self.sensor] == 0:
                self.watt[self.sensor]=0
            else:
                self.watt[self.sensor]=\
                    math.sqrt(self.sample_buffer[self.sensor]\
                    /self.sample_length[self.sensor])*VOLTAGE*TO_KILOWATT

        self.recorder.record(self.watt)
        self.reset_valiables()


sampler = Sampler(MEASURE_INTERVAL)
sampler.loop()
Service registration
Create service registration information.
sudo vi /etc/systemd/system/whmonitor.service
The content is like this. Even if the program stops, it will restart automatically.
/etc/systemd/system/whmonitor.service
[Unit]
Description = watt hour monitor

[Service]
ExecStart = /opt/whmonitor/bin/whmonitor.py
Restart = always
Type = simple

[Install]
WantedBy = multi-user.target
Enable and run the service.
sudo systemctl enable whmonitor
sudo systemctl start whmonitor
slee-Pi setup
slee-Pi monitors the aliveness of the OS by installing sleepi-firmware. With standard firmware, the OS seems to send HEARTBEAT to GPIO5 and slee-Pi is monitoring it. If HEARTBEAT cannot be confirmed for a certain period of time, the Raspberry Pi will be stopped or restarted.
I want to monitor the life and death of the application, so I cancel the standard firmware. By turning GPIO5 pin ON / OFF in the loop of the application, sleep-Pi is monitored for life and death.
sudo bash -c 'echo "deb http://mechatrax.github.io/sleepi ./" > /etc/apt/sources.list.d/sleepi.list'
sudo apt-get update
sudo apt-get install sleepi-archive-keyring
sudo apt-get update
sudo apt-get install sleepi-firmware
sudo shutdown -h now
- Unplug the Raspberry Pi (3GPI)
- Connect slee-Pi, 3GPI, AD converter board
- Connect power to slee-Pi
- Press the boot button on slee-Pi
#Stop the monitor program
sudo systemctl stop whmonitor.service
#Decrease i2c clock
sudo rmmod i2c_bcm2708
sudo modprobe i2c_bcm2708 baudrate=100000
#Check the timeout seconds from the end of the heartbeat to the shutdown
printf "%d\n" `i2cget -y 1 0x69 6 b`
#Set timeout to 120 seconds
i2cset -y 1 0x69 6 120
#Set the operation mode to "Restart enabled, power on again when no response"
i2cset -y 1 0x69 5 1
#Raise the i2c clock
sudo rmmod i2c_bcm2708
sudo modprobe i2c_bcm2708 baudrate=300000
#Start power consumption monitor program
sudo systemctl start whmonitor.service
# sleepi-Uninstall firmware
sudo apt-get remove sleepi-firmware
# reboot
sudo reboot
Database and receiver
Received on Sakura Internet rental server "Standard".
Database creation
create.sh
#!/bin/sh

/usr/local/bin/rrdtool-fix create  \
        /Database storage directory/watt.rrd --step 60 \
        DS:sensor0:GAUGE:120:0:1000000 \
        DS:sensor1:GAUGE:120:0:1000000 \
        DS:sensor2:GAUGE:120:0:1000000 \
        DS:sensor3:GAUGE:120:0:1000000 \
        RRA:AVERAGE:0.5:1:1054080 \
        RRA:MAX:0.5:1:1054080 \
        RRA:MIN:0.5:1:1054080 \
        RRA:LAST:0.5:1:1054080
Receiving program
whupdate.cgi
#!/usr/local/bin/python
# -*- coding: utf-8 -*-

import cgi
import cgitb
import os
import sys
import subprocess
import shlex
import bz2
import re

cgitb.enable()

if os.environ['REQUEST_METHOD'] != "POST":
    print 'invalid access'
    sys.exit()

rrd="/Database storage directory/watt.rrd"
lines = bz2.decompress(sys.stdin.read())
if re.match("^[0-9 :\.]+$",lines):
    cmd='/usr/local/bin/rrdtool-fix update {rrd} {param}'.format(rrd=rrd,param=lines)
    ret=subprocess.check_output(shlex.split(cmd))

print ('Content-type: text/html; charset=UTF-8')
print ("\r\n\r\n")
print
graph display
Download IPA Font. IPA Gothic (not P Gothic) is recommended. Since the font is monospaced, the vertical lines are hard to collapse. Save ipag.ttf in the same directory as your graph display program.
graph_total.cgi
#!/usr/local/bin/python
# -*- coding: utf-8 -*-

import subprocess
import os
import shlex
import cgi
import config
import sys
import re

os.environ["RRD_DEFAULT_FONT"]="/Font storage directory/ipag.ttf"
os.environ['LANG'] = 'ja_JP.UTF-8'

title=""
end="now"
start="now-12hour"
width=800
height=200


form=cgi.FieldStorage()
strnum=re.compile("^[0-9a-zA-Z\-]+$")

if form.has_key("title") and strnum.match(form["title"].value):
        title=" "+form["title"].value
if form.has_key("end") and strnum.match(form["end"].value):
    end=form["end"].value
if form.has_key("start") and strnum.match(form["start"].value):
        start=form["start"].value
if form.has_key("width") and form["width"].value.isdigit():
        width=form["width"].value
if form.has_key("height") and form["height"].value.isdigit():
        height=form["height"].value
if form.has_key("graph_id") and form["graph_id"].value.isdigit():
        graph_id=int(form["graph_id"].value)

cmd_src='/usr/local/bin/rrdtool-fix graph - \
            --start {start} --end {end} \
            --width {width} --height {height} \
            --title "electricity charges{title}" \
            --font "DEFAULT:9:" \
            --font "TITLE:12:" \
            --font "LEGEND:12:" \
            --lower-limit 0 --step 60 --slope-mode \
            --vertical-label "Watts" \
            DEF:s0_avg={rrd}:sensor0:AVERAGE \
            DEF:s1_avg={rrd}:sensor1:AVERAGE \
            DEF:s0_max={rrd}:sensor0:MAX \
            DEF:s1_max={rrd}:sensor1:MAX \
            DEF:s0_min={rrd}:sensor0:MIN \
            DEF:s1_min={rrd}:sensor1:MIN \
            CDEF:main_avg=s0_avg,s1_avg,+ \
            CDEF:main_max=s0_max,s1_max,+ \
            CDEF:main_min=s0_min,s1_min,+ \
            CDEF:main_yps=main_avg,3600,1000,*,/,25,* \
            VDEF:main_yen=main_yps,TOTAL \
            LINE1:main_avg#00ff00ff:"" \
            AREA:main_avg#00ff0033:"" \
            COMMENT:" \\n" \
            GPRINT:main_yen:"electricity charges%7.1lf yen" '

rrd="/Database storage directory/watt.rrd"
cmd=cmd_src\
    .format(rrd=rrd,width=width,height=height,start=start,end=end,title=title)
output=subprocess.check_output(shlex.split(cmd))

print ('Content-type: image/gif')
print
print output
graph_para.cgi
#!/usr/local/bin/python
# -*- coding: utf-8 -*-

import subprocess
import os
import shlex
import cgi
import config
import sys
import re

os.environ["RRD_DEFAULT_FONT"]="/Directory where fonts are stored/ipag.ttf"
os.environ['LANG'] = 'ja_JP.UTF-8'

title=""
end="now"
start="now-12hour"
width=800
height=200
graph_id=0


form=cgi.FieldStorage()
strnum=re.compile("^[0-9a-zA-Z\-]+$")

if form.has_key("title") and strnum.match(form["title"].value):
        title=" "+form["title"].value
if form.has_key("end") and strnum.match(form["end"].value):
    end=form["end"].value
if form.has_key("start") and strnum.match(form["start"].value):
        start=form["start"].value
if form.has_key("width") and form["width"].value.isdigit():
        width=form["width"].value
if form.has_key("height") and form["height"].value.isdigit():
        height=form["height"].value
if form.has_key("graph_id") and form["graph_id"].value.isdigit():
        graph_id=int(form["graph_id"].value)

cmd_src='/usr/local/bin/rrdtool-fix graph - \
            --start {start} --end {end} \
            --width {width} --height {height} \
            --title "Power consumption per circuit{title}" \
            --font "DEFAULT:9:" \
            --font "TITLE:12:" \
            --font "LEGEND:10:" \
            --lower-limit 0 --step 60 --slope-mode \
            --vertical-label "Watts" \
            DEF:s0_avg={rrd}:sensor0:AVERAGE \
            DEF:s1_avg={rrd}:sensor1:AVERAGE \
            DEF:s2_avg={rrd}:sensor2:AVERAGE \
            DEF:s3_avg={rrd}:sensor3:AVERAGE \
            DEF:s0_max={rrd}:sensor0:MAX \
            DEF:s1_max={rrd}:sensor1:MAX \
            DEF:s2_max={rrd}:sensor2:MAX \
            DEF:s3_max={rrd}:sensor3:MAX \
            DEF:s0_min={rrd}:sensor0:MIN \
            DEF:s1_min={rrd}:sensor1:MIN \
            DEF:s2_min={rrd}:sensor2:MIN \
            DEF:s3_min={rrd}:sensor3:MIN \
            CDEF:total_avg=s0_avg,s1_avg,+ \
            CDEF:total_max=s0_max,s1_max,+ \
            CDEF:total_min=s0_min,s1_min,+ \
            CDEF:total_yps=total_avg,3600,1000,*,/,25,* \
            VDEF:total_yen=total_yps,TOTAL \
            CDEF:others_avg=s0_avg,s1_avg,+,s2_avg,s3_avg,+,- \
            CDEF:others_min=s0_min,s1_min,+,s2_min,s3_min,+,- \
            CDEF:others_max=s0_max,s1_max,+,s2_max,s3_max,+,- \
            CDEF:s2_yps=s2_avg,3600,1000,*,/,25,* \
            VDEF:s2_yen=s2_yps,TOTAL \
            CDEF:s3_yps=s3_avg,3600,1000,*,/,25,* \
            VDEF:s3_yen=s3_yps,TOTAL \
            CDEF:others_yps=others_avg,3600,1000,*,/,25,* \
            VDEF:others_yen=others_yps,TOTAL \
            COMMENT:"__________\t_cost___ _cur_ _min_ _max_ _ave_"\
            COMMENT:"\\n" \
            LINE1:total_avg#00ff0077:"total\t\g" \
            GPRINT:total_yen:"%7.1lf\g"  \
            GPRINT:total_avg:LAST:" %5.0lf\g"  \
            GPRINT:total_min:MIN:" %5.0lf\g"  \
            GPRINT:total_max:MAX:" %5.0lf\g"  \
            GPRINT:total_avg:AVERAGE:" %5.0lf\g"  \
            COMMENT:"\\n" \
            LINE1:s2_avg#00aa88:"living\t\g" \
            GPRINT:s2_yen:"%7.1lf\g"  \
            GPRINT:s2_avg:LAST:" %5.0lf\g"  \
            GPRINT:s2_min:MIN:" %5.0lf\g"  \
            GPRINT:s2_max:MAX:" %5.0lf\g"  \
            GPRINT:s2_avg:AVERAGE:" %5.0lf\g"  \
            COMMENT:"\\n" \
            LINE1:s3_avg#8800aa:"kitchen\t\g" \
            GPRINT:s3_yen:"%7.1lf\g"  \
            GPRINT:s3_avg:LAST:" %5.0lf\g" \
            GPRINT:s3_min:MIN:" %5.0lf\g" \
            GPRINT:s3_max:MAX:" %5.0lf\g" \
            GPRINT:s3_avg:AVERAGE:" %5.0lf\g" \
            COMMENT:"\\n" \
            LINE1:others_avg#aa8800:"Other\t\g" \
            GPRINT:others_yen:"%7.1lf\g"  \
            GPRINT:others_avg:LAST:" %5.0lf\g"  \
            GPRINT:others_min:MIN:" %5.0lf\g"  \
            GPRINT:others_max:MAX:" %5.0lf\g"  \
            GPRINT:others_avg:AVERAGE:" %5.0lf"  \
            '

rrd="/Database storage directory/watt.rrd"
cmd=cmd_src\
    .format(rrd=rrd,width=width,height=height,start=start,end=end,title=title)
output=subprocess.check_output(shlex.split(cmd))


print ('Content-type: image/gif')
print
print output
Browsing
After about 5 minutes, access the following URL to check the graph.
http://[公開サーバー]/[ディレクトリ]/graph_total.cgi http://[公開サーバー]/[ディレクトリ]/graph_para.cgi
Complete
I was able to display the graph in the browser. With this, you can expose standby power and gluttony appliances.
Summary
I will review the overall composition.
Data flow
The data flow is divided into two systems. Here, it is described as a data collection system and a data display system.
Data collection system
- Convert current to voltage with current sensor and resistor
- Amplified and sampled with ADS1015
- Get sampling data with Raspberry Pi (using I2C bus and ADS1x15 library)
- Calculation 5.3 Send to CGI on data management server via 3GPI
- Received by CGI and saved to RRDtool's round robin database
Data display system
- Browser requests CGI to display graph
- CGI causes RRDtool to generate a graph and send it to the browser
- Display in browser
Programs and settings
Collect the developed programs, configuration files, and necessary external files.
Raspberry Pi side
--Measurement program whmonitor.py --Service configuration file /etc/systemd/system/whmonitor.service
Server side
--RRDtool database generator create.sh --Data receiving program whupdate.cgi --Graph display program graph_total.cgi --Graph display program graph_para.cgi --Font file ipag.ttf
Impressions
You can now measure the power consumption safely. 3G communication was possible, application operation monitoring was possible, power consumption was measured, and a graph could be displayed. Power consumption measurement is a recommended electronic work because it is practical and easy to prepare hardware. However, please be careful about the work on the distribution board and the insulation around the sensor.
There is a risk of death, such as electric shock during work, electric leakage due to installed equipment, or fire due to a short circuit. I can't judge whether the installation of the current sensor on the distribution board corresponds to electrical work that requires a license. I studied as a second-class electrician, but depending on the interpretation, it can be read as necessary or unnecessary. In any case, it is better to understand the risks, so it is safe to have the knowledge equivalent to a second-class electrician. The SHARP website provides an example of "customer-confident installation". → Can I install the single-circuit CT sensor unit by myself?
About measurement results
When I started collecting data, I was interested in devices with high peak power. Calculate the electricity bill per time. The unit price of electricity is set at 25 yen per kWh based on the actual results in 2015.
| Used equipment | Average power consumption[w] | Average usage time[h] | Power consumption[kWh] | electricity charges[Circle] |
|---|---|---|---|---|
| microwave | 1500 | 0.033 | 0.050 | 1.3 |
| Bathroom Dryer | 800 | 4.0 | 3.2 | 80 |
| Futon dryer | 600 | 2.0 | 1.2 | 30 |
| Various standby power | 80 | 24 | 1.2 | 30 |
Two weeks after the measurement, I could see the rough price per day.
| Item | Average power consumption[w] | Average usage time[h] | Power consumption[kWh] | electricity charges[Circle] |
|---|---|---|---|---|
| total | 250 | 24 | 6.0 | 150 |
| Standby power | 50 | 18 | 0.9 | 23 |
According to this, 15% was standby power. Devices counted as standby power are microwave ovens, rice cookers, yogurt makers, home bakeries, TVs, WiFi routers, WiFi repeaters, PC speakers, external HDDs, notebook PCs (power off), desktop PCs (power off), PCs. Monitor and printer. There are quite a few to list, but I kept the outlets connected, including the ones I use only occasionally. Thoroughly unplugging when not in use will reduce your electricity bill by 15%. The annual electricity bill in 2015 was 60,000 yen, so it may have been reduced to 51,000 yen.
I felt that standby power measures would be effective in reducing electricity prices.
About power consumption data
Looking at the power increase / decrease pattern, I can roughly understand what time and what I did. Use of air conditioner. Use of microwave oven. Refrigerator load due to temperature. Use of rice cooker. Lighting on. Wake-up time, bedtime. Use of the toilet at night, etc. With the spread of smart meters, electric power companies will be able to acquire changes in electricity usage. By analyzing the electricity usage of each household, you can understand what is happening at home. Especially the pattern of the microwave oven is characteristic. You can get information about when and how many times you used it, and how many times a day you used it. It may be coveted data for home appliance makers.
The running Raspberry Pi seems to be able to sample about 1600 times per second. Even if the power frequency is 60Hz, you can sample 26 times per cycle. I think that it is a level that can analyze waveforms somehow, so it may be possible to analyze whether the equipment being consumed is a load such as a motor, an inverter, a heater, etc.
About development
I used Raspberry Pi for the first time, and it's working fairly well. Also, I am grateful for the large amount of information. I thank my ancestors. I didn't have to worry about running it continuously. Python was also very informative and easy to learn. There are many libraries, and I felt why they were so popular. I'm a little embarrassed because I don't think I've been able to program according to Python's practices.
The total development time is about 40 to 50 hours. Hardware development took about 5 hours for parts selection, design, and manufacturing. It's impressive that the time it took to develop the hardware was very short, thanks to the ADS1015. Since the scale of the circuit was small, I soldered it from the beginning, but I think that it can be developed in a shorter time if it is assembled with a breadboard.
I have the impression that software development took a long time. I was particularly addicted to how to use RRDtool. Trying to do something elaborate required a lot of information and trial and error. In particular, I have the impression that it took a long time to find out how to use the VDEF syntax. 3GPI is very convenient because it works without thinking. If I knew how to use NetworkManager, I thought that I could use it more advancedly, such as setting up a backup line. Originally, slee-Pi is a device that monitors the operation of the OS, but I wanted to monitor the operation of the application, so I did not use the driver of the manufacturer. Since it is generating a heartbeat inside the application loop, it will automatically restart the Raspberry Pi when the application stops. You can also use the watchdog function of Raspberry Pi, but it is safe to force a restart from the outside.
Notes
Attaching the sensor to the distribution board has a risk of death such as electric shock during work, electric leakage due to installed equipment, and fire due to short circuit. Please be careful when making a decision, including whether or not it can be implemented.