[PYTHON] Draw graphs in the programming language Julia
I tried to build an environment to draw a graph with the programming language Julia. The PySide Package has been added.
The sample program that displays the graph at the end of the sentence is attached to the PySide package of Julia. With some modifications (added PySide.app [: exec_]() to the last line).
(If you have any bugs or comments, please contact https://twitter.com/akmiyoshi)
I have
(later) posted the procedure for building an environment on Windows 7 </ del>. If you are interested, please stock.
My environment is Windows 7 Home Premium 64bit, but I installed the 32bit version of the program for all environment construction. If you follow this procedure, it will work on both 32bit and 64bit versions of Windows OS (XP SP2 or later).
[Addition] Steps 4, 6 and 11 have been added to 2014/07/04. If you have seen this article before 2014/07/04 and built the environment, please follow steps 4, 6 and 11. Thank you.
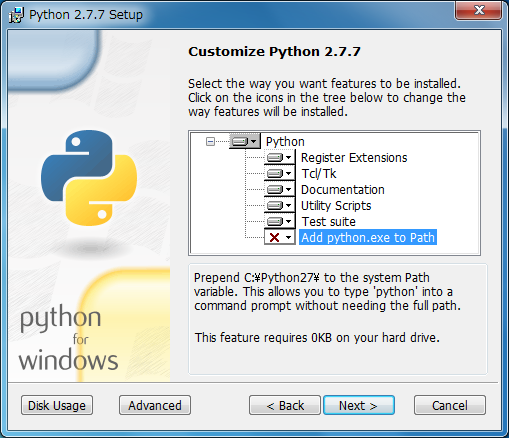
1. Install Python 2.7.7 (32bit).
- From https://www.python.org/download/, go to Python 2.7.7 Windows Installer to download. (Note that it is not an X86-64 Installer)
- Launch python-2.7.7.msi and install. Install in the default C: \ Python27. ** Keep "Add python.exe to Path" enabled ** (disabled by default).
2. Install numpy (32bit).
- From http://sourceforge.net/projects/numpy/files/NumPy/1.8.1/ [numpy-1.8.1-win32-superpack-python2.7.exe](http://sourceforge.net/projects/ Download numpy / files / NumPy / 1.8.1 / numpy-1.8.1-win32-superpack-python2.7.exe / download).
- Launch numpy-1.8.1-win32-superpack-python2.7.exe and install with default settings.
3. Install scipy (32bit).
- From http://sourceforge.net/projects/scipy/files/scipy/0.14.0/ [scipy-0.14.0-win32-superpack-python2.7.exe](http://sourceforge.net/projects/ Download scipy / files / scipy / 0.14.0 / scipy-0.14.0-win32-superpack-python2.7.exe / download).
- Launch scipy-0.14.0-win32-superpack-python2.7.exe and install with default settings.
4. Install matplotlib. (Added on 2014/07/04)
- From http://matplotlib.org/downloads.html [matplotlib-1.3.1.win32-py2.7.exe](https://downloads.sourceforge.net/project/matplotlib/matplotlib/matplotlib-1.3.1 /matplotlib-1.3.1.win32-py2.7.exe) is downloaded.
- Start matplotlib-1.3.1.win32-py2.7.exe and install with the default settings.
5. Install pip (a tool for installing / managing Python packages).
- Open https://raw.githubusercontent.com/pypa/pip/master/contrib/get-pip.py in your web browser
- For Google Chrome, right-click on the text and select "Save As". For Internet Explorer, press Alt and select "Save As" from the File menu. (If you don't know how to save it as, use Ctrl-A to select all the text, paste it into a text editor, and save it as get-pip.py)
- Start the command prompt ("Start Button" ⇒ "All Programs" ⇒ "Accessories" ⇒ "Command Prompt") Start
python </ del> get-pip.py as follows. ("C: \ get-pip.py" is an example when get-pip.py is saved directly under the C drive)
C:\Users\root>c:\get-pip.py
6. Install the matplotlib dependent libraries. (Added on 2014/07/04)
C:\Users\root>cd \Python27\Scripts
- Start a command prompt, change the current directory to "C: \ Python27 \ Scripts", and then execute "pip install -U python -dateutil" and "pip install -U pyparsing".
C:\Users\root>cd \Python27\Scripts
C:\Python27\Scripts>pip install -U python-dateutil
C:\Python27\Scripts>pip install -U pyparsing
7. Install PySide.
- Start a command prompt, change the current directory to "C: \ Python27 \ Scripts", and execute "pip install -U PySide".
C:\Users\root>cd \Python27\Scripts
C:\Python27\Scripts>pip install -U PySide
8. Install PyOpenGL.
- Start a command prompt, change the current directory to "C: \ Python27 \ Scripts", and execute "pip install -U PyOpen GL".
C:\Users\root>cd \Python27\Scripts
C:\Python27\Scripts>pip install -U PyOpenGL
9. Install PyQtGraph (32bit).
- Download pyqtgraph-0.9.8.win32.exe from http://www.pyqtgraph.org/.
- Start pyqtgraph-0.9.8.win32.exe and install with the default settings.
- Double-click * .py under C: \ Python27 \ Lib \ site-packages \ pyqtgraph \ examples and check that various graphs (2D / 3D) are displayed.
10. Install Julia (32bit).
- From http://julialang.org/downloads/ [julia-0.2.1-win32.exe](http://s3.amazonaws.com/julialang/bin/winnt/x86/0.2/julia-0.2.1- Download win32.exe).
- Start julia-0.2.1-win32.exe and extract it directly under the C drive (C: \).
- The folder name after decompression will be something like "julia-e44b593905", so change it to "julia-0.2.1-win32".
- Create a shortcut to "C: \ julia-0.2.1-win32 \ julia.bat" on your desktop.
- Open "C: \ julia-0.2.1-win32 \ julia.bat" with a text editor and edit it. Type "pause" below the last line. (This step is optional, but useful when you get an error in your Julia program)
11. Add the PyPlot package to Julia. (Added on 2014/07/04)
- Double-click the shortcut to julia.bat to launch the Julia interpreter.
- Execute "Pkg.add (" PyPlot ")".
julia> Pkg.add("PyPlot")
12. Add the PySide package to Julia.
- Double-click the shortcut to julia.bat to launch the Julia interpreter.
- Execute "Pkg.add (" PySide ")".
julia> Pkg.add("PySide")
13. Run the sample program.
- Save the source code (pyqtgraph.jl) at the end of the sentence in an arbitrary directory with the file name "pyqtgraph.jl".
- Double-click the saved "pyqtgraph.jl". Select "Select a program from the list of installed programs" and click "OK". Then press "Browse", select "C: \ julia-0.2.1-win32 \ julia.bat" and click "Open". (Associate "julia.bat" with the extension ".jl")
- Success if the above screen (of 9 graphs) is displayed.
pyqtgraph.jl
## using the PyQtGraph submodule
## Examples from pyqtgraphs plotting.py
## translated into julia style

using PySide
reload(Pkg.dir("PySide", "src", "pyqtgraph.jl"))
using PyQtGraph
using PyCall


w = Widget()
lyt = VBoxLayout(w)
setLayout(w, lyt)

## Graphics Layout Widget make grid of plot devices
win = GraphicsLayoutWidget(w)
addWidget(lyt, win)
set_size(w, 800, 600)

raise(w)

## addPlot adds a plot device in next column over and returns a plot object
p1 = addPlot(win, title="Basic array plotting")
p1.plot(randn(100))

p2 = addPlot(win, title="Multiple curves")
p2.plot(randn(100), pen=(255,0,0))
p2.plot(randn(100) .+ 5, pen=(0, 255, 0))
p2.plot(randn(100) .+ 10, pen=(0,0,255))


p3 = addPlot(win, title="Drawing with points")
p3.plot(randn(100), pen=(200, 200, 200), symbolBrush=(255,0,0), symbolPen="w")

nextRow(win)

p4 = addPlot(win, title="Parametric, grid enabled")
p4.plot(sin(linspace(0, 2pi, 1000)), cos(linspace(0, 2pi, 1000)))
p4.showGrid()                   # defaults x=true, y=true

p5 = addPlot(win, title="Scatter plot, axis labels, log scale")
x = 1e-5 * rand(1000)
y = x*1000 .+ 0.005 * randn(1000)
y -= minimum(y).-1.0
mask = x .> 1e-15
x = x[mask]
y = y[mask]
p5.plot(x, y, pen=nothing, symbol="t", symbolPen=nothing, symbolSize=10, symbolBrush=(100, 100, 255, 50))
p5.setLabel("left", text="Y Axis", units="A")
p5.setLabel("bottom", text="Y Axis", units="s")
p5.setLogMode(x=true, y=false)


p6 = addPlot(win, title="Updating plot")

curve = p6.plot(pen="y")
data = randn(10000, 10)
ptr = 0
function update()
    global curve, data, ptr, p6
    qinvoke(curve, :setData, 1:10_000, data[:, 1 + ptr]) # had to fix this
    if ptr == 0
        p6.enableAutoRange("xy", false)  ## stop auto-scaling after the first data set is plotted
    end
    ptr = (ptr + 1) % 10
end


timer = QtCore[:QTimer]()
qconnect(timer, :timeout, update)
qinvoke(timer, :start, 50)


nextRow(win)


p7 = addPlot(win, title="Filled plot, axis disabled")
y = sin(linspace(0.0, 10, 1000)) .+ randn(1000)*0.1
p7.plot(y, fillLevel=-0.3, brush=(50,50,200,100))
p7.showAxis("bottom", show=false)


p8 = addPlot(win, title="Region Selection")

x2 = linspace(-100, 100, 1000)
data2 = sin(x2) ./ x2
p8.plot(data2, pen=(255,255,255,200))

## no special functions for LinearRegionItem
lr = pyqtgraph.(:LinearRegionItem)([400,700])
qinvoke(lr, :setZValue, -10)
p8.addItem(lr)

p9 = addPlot(win, title="zoom")
p9.plot(data2)

function updatePlot()
    p9.setXRange(lr[:getRegion]()...,padding=0)
end
function updateRegion()
    view_range = qinvoke(p9, [:getViewBox, :viewRange]) # 2x2 array
    x_range = Int[view_range[1,j] for j in 1:2]         # a vector, not just view_range[1,:]'
    lr[:setRegion](x_range)
end
qconnect(lr, :sigRegionChanged, updatePlot)
#qconnect(p9, :sigXRangeChanged, updateRegion) ## this is giving issues. Find out why.
updatePlot()

 #raise(w)

PySide.app[:exec_]()
Recommended Posts