[PYTHON] Pandas User Guide "Manipulating Missing Data" (Official Document Japanese Translation)
This article is a partial machine translation of the official Pandas documentation User Guide --Working with missing data. It is a modification of an unnatural sentence.
If you have any mistranslations, alternative translations, questions, etc., please use the comments section or edit request.
Manipulating missing data
This section describes missing values (NA) for pandas.
: information_source: ** Note ** I chose to use
NaNinternally to indicate missing data, primarily for simplicity and performance reasons. Starting with pandas 1.0, some optional data types start trying nativeNAscalars using a mask-based approach. See [here](#Experimental na scalar to show missing values) for more information.
Value considered "missing"
Because data exists in many forms and formats, pandas wants to be flexible when it comes to handling missing data. NaN is the default missing value marker for computational speed and convenience, but it should be easy to detect for floating point, integer, boolean, and various types of data types for general objects. .. However, in many cases you will also see Python's None, and you should also consider" missing "or" unavailable "or" NA ".
: information_source: ** Note ** If you want ʻinf
and-infto be considered "NA" in your calculations, you can set them withpandas.options.mode.use_inf_as_na = True`.
In [**]: df = pd.DataFrame(np.random.randn(5, 3), index=['a', 'c', 'e', 'f', 'h'],
   ....:                   columns=['one', 'two', 'three'])
   ....:

In [**]: df['four'] = 'bar'

In [**]: df['five'] = df['one'] > 0

In [**]: df
Out[**]:
        one       two     three four   five
a  0.469112 -0.282863 -1.509059  bar   True
c -1.135632  1.212112 -0.173215  bar  False
e  0.119209 -1.044236 -0.861849  bar   True
f -2.104569 -0.494929  1.071804  bar  False
h  0.721555 -0.706771 -1.039575  bar   True

In [**]: df2 = df.reindex(['a', 'b', 'c', 'd', 'e', 'f', 'g', 'h'])

In [**]: df2
Out[**]:
        one       two     three four   five
a  0.469112 -0.282863 -1.509059  bar   True
b       NaN       NaN       NaN  NaN    NaN
c -1.135632  1.212112 -0.173215  bar  False
d       NaN       NaN       NaN  NaN    NaN
e  0.119209 -1.044236 -0.861849  bar   True
f -2.104569 -0.494929  1.071804  bar  False
g       NaN       NaN       NaN  NaN    NaN
h  0.721555 -0.706771 -1.039575  bar   True
To facilitate the detection of missing values (sometimes through arrays of different data types), pandas isna () /pandas.isna.html#pandas.isna) </ code> and [notna ()](https://pandas.pydata.org/pandas-docs/stable/reference/api/pandas.notna.html # pandas.notna) </ code> functions are provided. These are also methods for Series and DataFrame objects.
In [**]: df2['one']
Out[**]:
a    0.469112
b         NaN
c   -1.135632
d         NaN
e    0.119209
f   -2.104569
g         NaN
h    0.721555
Name: one, dtype: float64

In [**]: pd.isna(df2['one'])
Out[**]:
a    False
b     True
c    False
d     True
e    False
f    False
g     True
h    False
Name: one, dtype: bool

In [**]: df2['four'].notna()
Out[**]:
a     True
b    False
c     True
d    False
e     True
f     True
g    False
h     True
Name: four, dtype: bool

In [**]: df2.isna()
Out[**]:
     one    two  three   four   five
a  False  False  False  False  False
b   True   True   True   True   True
c  False  False  False  False  False
d   True   True   True   True   True
e  False  False  False  False  False
f  False  False  False  False  False
g   True   True   True   True   True
h  False  False  False  False  False
: warning: ** Warning ** It should be noted that in Python (and NumPy),
nanis not equivalent andNoneis ** equivalent **. Note that pandas / NumPy treatsNonelikenp.nan, while using the fact thatnp.nan! = Np.nan.In [**]: None == None # noqa: E711 Out[**]: True In [**]: np.nan == np.nan Out[**]: FalseTherefore, compared to the above, scalar equivalence comparisons for
None / np.nando not provide useful information.In [**]: df2['one'] == np.nan Out[**]: a False b False c False d False e False f False g False h False Name: one, dtype: bool
Integer data type and missing data
Since NaN is a floating point number, a sequence of integers that has at least one missing value is converted to a floating point number data type (for more information, see Integer NA Support (https: // pandas. See pydata.org/pandas-docs/stable/user_guide/gotchas.html#gotchas-intna)). pandas provides an array of integers that can contain missing values. This can be used by explicitly specifying the data type.
In [**]: pd.Series([1, 2, np.nan, 4], dtype=pd.Int64Dtype())
Out[**]:
0       1
1       2
2    <NA>
3       4
dtype: Int64
It can also be used by specifying the string alias dtype ='Int64' (note the uppercase " I ").
See Missing Integer Data Types for more information.
Time series data (datetime)
For datetime64 \ [ns ] type, NaT represents the missing value. This is a pseudo-native sentinel value that can be represented by a single NumPy data type (datetime64 \ [ns ]). The pandas object provides compatibility between NaT and NaN.
In [**]: df2 = df.copy()

In [**]: df2['timestamp'] = pd.Timestamp('20120101')

In [**]: df2
Out[**]:
        one       two     three four   five  timestamp
a  0.469112 -0.282863 -1.509059  bar   True 2012-01-01
c -1.135632  1.212112 -0.173215  bar  False 2012-01-01
e  0.119209 -1.044236 -0.861849  bar   True 2012-01-01
f -2.104569 -0.494929  1.071804  bar  False 2012-01-01
h  0.721555 -0.706771 -1.039575  bar   True 2012-01-01

In [**]: df2.loc[['a', 'c', 'h'], ['one', 'timestamp']] = np.nan

In [**]: df2
Out[**]:
        one       two     three four   five  timestamp
a       NaN -0.282863 -1.509059  bar   True        NaT
c       NaN  1.212112 -0.173215  bar  False        NaT
e  0.119209 -1.044236 -0.861849  bar   True 2012-01-01
f -2.104569 -0.494929  1.071804  bar  False 2012-01-01
h       NaN -0.706771 -1.039575  bar   True        NaT

In [**]: df2.dtypes.value_counts()
Out[**]:
float64           3
object            1
datetime64[ns]    1
bool              1
dtype: int64
Insert missing data
You can insert missing values simply by assigning them to a container. The actual missing value used is selected based on the data type.
For example, a numeric container will always use NaN, regardless of the type of missing value given.
In [**]: s = pd.Series([1, 2, 3])

In [**]: s.loc[0] = None

In [**]: s
Out[**]:
0    NaN
1    2.0
2    3.0
dtype: float64
Similarly, time series containers always use NaT.
For object containers, pandas will use the given value.
In [**]: s = pd.Series(["a", "b", "c"])

In [**]: s.loc[0] = None

In [**]: s.loc[1] = np.nan

In [**]: s
Out[**]:
0    None
1     NaN
2       c
dtype: object
Calculations for missing data
Missing values propagate naturally through arithmetic operations between pandas objects.
In [**]: a
Out[**]:
        one       two
a       NaN -0.282863
c       NaN  1.212112
e  0.119209 -1.044236
f -2.104569 -0.494929
h -2.104569 -0.706771

In [**]: b
Out[**]:
        one       two     three
a       NaN -0.282863 -1.509059
c       NaN  1.212112 -0.173215
e  0.119209 -1.044236 -0.861849
f -2.104569 -0.494929  1.071804
h       NaN -0.706771 -1.039575

In [**]: a + b
Out[**]:
        one  three       two
a       NaN    NaN -0.565727
c       NaN    NaN  2.424224
e  0.238417    NaN -2.088472
f -4.209138    NaN -0.989859
h       NaN    NaN -1.413542
Data Structure Overview (and here -docs / stable / reference / series.html # api-series-stats) and here All of the descriptive statistics and calculation methods described in (List of) are written to explain missing data. For example:
--When summing data, NA (missing) values are treated as zero.
--If all the data is NA, the result will be 0.
- cumsum () </ code> and < Cumulative methods such as code> cumprod () </ code> Ignores NA values by default, but keeps them in the resulting array. To override this behavior and include the NA value, use skipna = False.
In [**]: df
Out[**]:
        one       two     three
a       NaN -0.282863 -1.509059
c       NaN  1.212112 -0.173215
e  0.119209 -1.044236 -0.861849
f -2.104569 -0.494929  1.071804
h       NaN -0.706771 -1.039575

In [**]: df['one'].sum()
Out[**]: -1.9853605075978744

In [**]: df.mean(1)
Out[**]:
a   -0.895961
c    0.519449
e   -0.595625
f   -0.509232
h   -0.873173
dtype: float64

In [**]: df.cumsum()
Out[**]:
        one       two     three
a       NaN -0.282863 -1.509059
c       NaN  0.929249 -1.682273
e  0.119209 -0.114987 -2.544122
f -1.985361 -0.609917 -1.472318
h       NaN -1.316688 -2.511893

In [**]: df.cumsum(skipna=False)
Out[**]:
   one       two     three
a  NaN -0.282863 -1.509059
c  NaN  0.929249 -1.682273
e  NaN -0.114987 -2.544122
f  NaN -0.609917 -1.472318
h  NaN -1.316688 -2.511893
Sum / Infinite product in empty / missing data
: warning: ** Warning ** This behavior is current standard for v0.22.0 and matches the default for
numpy. Previously, the sum / infinite product for all NAs or empty Series / DataFrames returned NaN. For more information, see v0.22.0 whatsnew.
The sum of columns in a Series or DataFrame that is empty or all NA is 0.
In [**]: pd.Series([np.nan]).sum()
Out[**]: 0.0

In [**]: pd.Series([], dtype="float64").sum()
Out[**]: 0.0
The infinite product of a series or DataFrame column that is empty or all NA is 1.
In [**]: pd.Series([np.nan]).prod()
Out[**]: 1.0

In [**]: pd.Series([], dtype="float64").prod()
Out[**]: 1.0
Missing values in GroupBy
GroupBy automatically excludes NA groups. This behavior is consistent with R. For example
In [**]: df
Out[**]:
        one       two     three
a       NaN -0.282863 -1.509059
c       NaN  1.212112 -0.173215
e  0.119209 -1.044236 -0.861849
f -2.104569 -0.494929  1.071804
h       NaN -0.706771 -1.039575

In [**]: df.groupby('one').mean()
Out[**]:
                two     three
one
-2.104569 -0.494929  1.071804
 0.119209 -1.044236 -0.861849
See the groupby section here [https://pandas.pydata.org/pandas-docs/stable/user_guide/groupby.html#groupby-missing) for more information.
Exclusion / fill in missing data
The pandas object is equipped with various data manipulation methods for handling missing data.
Filling in the missing values-fillna
fillna () </ code> is missing You can "fill in" the values with non-missing data.
** Replace missing values with scalar values **
In [**]: df2
Out[**]:
        one       two     three four   five  timestamp
a       NaN -0.282863 -1.509059  bar   True        NaT
c       NaN  1.212112 -0.173215  bar  False        NaT
e  0.119209 -1.044236 -0.861849  bar   True 2012-01-01
f -2.104569 -0.494929  1.071804  bar  False 2012-01-01
h       NaN -0.706771 -1.039575  bar   True        NaT

In [**]: df2.fillna(0)
Out[**]:
        one       two     three four   five            timestamp
a  0.000000 -0.282863 -1.509059  bar   True                    0
c  0.000000  1.212112 -0.173215  bar  False                    0
e  0.119209 -1.044236 -0.861849  bar   True  2012-01-01 00:00:00
f -2.104569 -0.494929  1.071804  bar  False  2012-01-01 00:00:00
h  0.000000 -0.706771 -1.039575  bar   True                    0

In [**]: df2['one'].fillna('missing')
Out[**]:
a     missing
c     missing
e    0.119209
f    -2.10457
h     missing
Name: one, dtype: object
** Fill in the blanks with forward or backward data **
Propagate non-missing values forward or backward using similar fill-in-the-blank parameters as Reindexing (https://pandas.pydata.org/pandas-docs/stable/user_guide/basics.html#basics-reindexing) You can.
In [**]: df
Out[**]:
        one       two     three
a       NaN -0.282863 -1.509059
c       NaN  1.212112 -0.173215
e  0.119209 -1.044236 -0.861849
f -2.104569 -0.494929  1.071804
h       NaN -0.706771 -1.039575

In [**]: df.fillna(method='pad')
Out[**]:
        one       two     three
a       NaN -0.282863 -1.509059
c       NaN  1.212112 -0.173215
e  0.119209 -1.044236 -0.861849
f -2.104569 -0.494929  1.071804
h -2.104569 -0.706771 -1.039575
** Limiting the amount of filling **
If you just want to fill a contiguous gap to a certain data point, you can use the * limit * keyword.
In [**]: df
Out[**]:
   one       two     three
a  NaN -0.282863 -1.509059
c  NaN  1.212112 -0.173215
e  NaN       NaN       NaN
f  NaN       NaN       NaN
h  NaN -0.706771 -1.039575

In [**]: df.fillna(method='pad', limit=1)
Out[**]:
   one       two     three
a  NaN -0.282863 -1.509059
c  NaN  1.212112 -0.173215
e  NaN  1.212112 -0.173215
f  NaN       NaN       NaN
h  NaN -0.706771 -1.039575
The available fill-in methods are:
| Method | motion |
|---|---|
| pad / ffill | Fill in the holes forward |
| bfill / backfill | Fill in the holes backwards |
The use of pad / ffill is so common in time series data that the "last known value" is available at all times.
ffill () </ code> is fillna Equivalent to (method ='ffill') , [bfill ()](https://pandas.pydata.org/pandas-docs/stable/reference/api/pandas.DataFrame.bfill.html# pandas.DataFrame.bfill) </ code> is equivalent to fillna (method ='bfill').
Fill in the blanks with pandas objects
You can also fill in the blanks with an alignable dictionary or series. The dictionary key or series index must match the column name of the frame you want to fill in. The following example inputs the average for that column in a data frame.
In [**]: dff = pd.DataFrame(np.random.randn(10, 3), columns=list('ABC'))

In [**]: dff.iloc[3:5, 0] = np.nan

In [**]: dff.iloc[4:6, 1] = np.nan

In [**]: dff.iloc[5:8, 2] = np.nan

In [**]: dff
Out[**]:
          A         B         C
0  0.271860 -0.424972  0.567020
1  0.276232 -1.087401 -0.673690
2  0.113648 -1.478427  0.524988
3       NaN  0.577046 -1.715002
4       NaN       NaN -1.157892
5 -1.344312       NaN       NaN
6 -0.109050  1.643563       NaN
7  0.357021 -0.674600       NaN
8 -0.968914 -1.294524  0.413738
9  0.276662 -0.472035 -0.013960

In [**]: dff.fillna(dff.mean())
Out[**]:
          A         B         C
0  0.271860 -0.424972  0.567020
1  0.276232 -1.087401 -0.673690
2  0.113648 -1.478427  0.524988
3 -0.140857  0.577046 -1.715002
4 -0.140857 -0.401419 -1.157892
5 -1.344312 -0.401419 -0.293543
6 -0.109050  1.643563 -0.293543
7  0.357021 -0.674600 -0.293543
8 -0.968914 -1.294524  0.413738
9  0.276662 -0.472035 -0.013960

In [**]: dff.fillna(dff.mean()['B':'C'])
Out[**]:
          A         B         C
0  0.271860 -0.424972  0.567020
1  0.276232 -1.087401 -0.673690
2  0.113648 -1.478427  0.524988
3       NaN  0.577046 -1.715002
4       NaN -0.401419 -1.157892
5 -1.344312 -0.401419 -0.293543
6 -0.109050  1.643563 -0.293543
7  0.357021 -0.674600 -0.293543
8 -0.968914 -1.294524  0.413738
9  0.276662 -0.472035 -0.013960
The result is the same as above, but in the following cases, the values of the series "Fill in" are aligned.
In [**]: dff.where(pd.notna(dff), dff.mean(), axis='columns')
Out[**]:
          A         B         C
0  0.271860 -0.424972  0.567020
1  0.276232 -1.087401 -0.673690
2  0.113648 -1.478427  0.524988
3 -0.140857  0.577046 -1.715002
4 -0.140857 -0.401419 -1.157892
5 -1.344312 -0.401419 -0.293543
6 -0.109050  1.643563 -0.293543
7  0.357021 -0.674600 -0.293543
8 -0.968914 -1.294524  0.413738
9  0.276662 -0.472035 -0.013960
Deleting axis labels with missing data-dropna
You may simply want to exclude labels that refer to missing data from your dataset. To do this, dropna () < Use / code>.
In [**]: df
Out[**]:
   one       two     three
a  NaN -0.282863 -1.509059
c  NaN  1.212112 -0.173215
e  NaN  0.000000  0.000000
f  NaN  0.000000  0.000000
h  NaN -0.706771 -1.039575

In [**]: df.dropna(axis=0)
Out[**]:
Empty DataFrame
Columns: [one, two, three]
Index: []

In [**]: df.dropna(axis=1)
Out[**]:
        two     three
a -0.282863 -1.509059
c  1.212112 -0.173215
e  0.000000  0.000000
f  0.000000  0.000000
h -0.706771 -1.039575

In [**]: df['one'].dropna()
Out[**]: Series([], Name: one, dtype: float64)
dropna () </ code> is available. DataFrame.dropna has considerably more options than Series.dropna, in the API (https://pandas.pydata.org/pandas-docs/stable/reference/frame.html#api-dataframe-missing) You can look it up.
interpolation
From _ version 0.23.0 _: The keyword argument limit_area has been added.
[interpolate ()](https://pandas.pydata.org/pandas-docs/stable/reference/api/pandas.DataFrame.interpolate.html#pandas.DataFrame. for both series and dataframe objects. There is interpolate) </ code> and by default it performs linear interpolation on the missing data points.
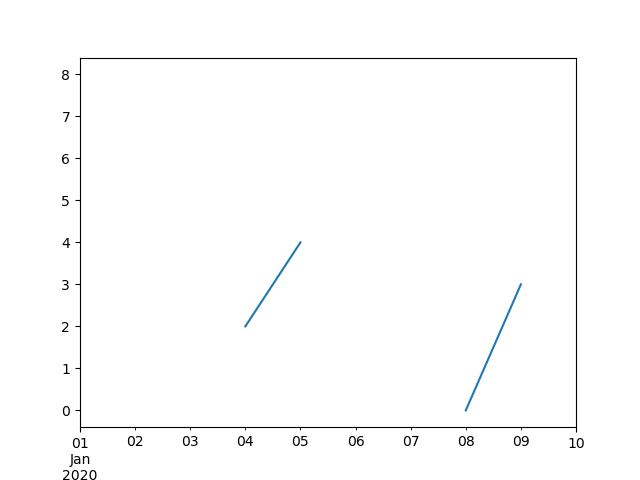
In [**]: ts
Out[**]:
2000-01-31    0.469112
2000-02-29         NaN
2000-03-31         NaN
2000-04-28         NaN
2000-05-31         NaN
                ...
2007-12-31   -6.950267
2008-01-31   -7.904475
2008-02-29   -6.441779
2008-03-31   -8.184940
2008-04-30   -9.011531
Freq: BM, Length: 100, dtype: float64

In [**]: ts.count()
Out[**]: 66

In [**]: ts.plot()
Out[**]: <matplotlib.axes._subplots.AxesSubplot at 0x7fc18e5ac400>
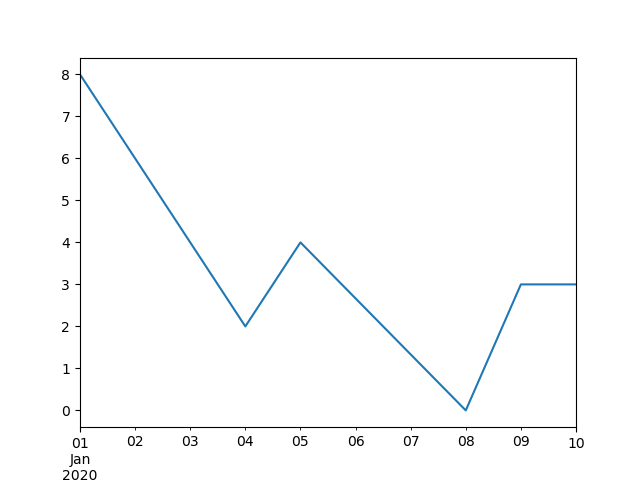
In [**]: ts.interpolate()
Out[**]:
2000-01-31    0.469112
2000-02-29    0.434469
2000-03-31    0.399826
2000-04-28    0.365184
2000-05-31    0.330541
                ...
2007-12-31   -6.950267
2008-01-31   -7.904475
2008-02-29   -6.441779
2008-03-31   -8.184940
2008-04-30   -9.011531
Freq: BM, Length: 100, dtype: float64

In [**]: ts.interpolate().count()
Out[**]: 100

In [**]: ts.interpolate().plot()
Out[**]: <matplotlib.axes._subplots.AxesSubplot at 0x7fc18e569880>
You can perform index-based interpolation by using the method keyword.
In [**]: ts2
Out[**]:
2000-01-31    0.469112
2000-02-29         NaN
2002-07-31   -5.785037
2005-01-31         NaN
2008-04-30   -9.011531
dtype: float64

In [**]: ts2.interpolate()
Out[**]:
2000-01-31    0.469112
2000-02-29   -2.657962
2002-07-31   -5.785037
2005-01-31   -7.398284
2008-04-30   -9.011531
dtype: float64

In [**]: ts2.interpolate(method='time')
Out[**]:
2000-01-31    0.469112
2000-02-29    0.270241
2002-07-31   -5.785037
2005-01-31   -7.190866
2008-04-30   -9.011531
dtype: float64
For floating point indexes, use method ='values'.
In [**]: ser
Out[**]:
0.0      0.0
1.0      NaN
10.0    10.0
dtype: float64

In [**]: ser.interpolate()
Out[**]:
0.0      0.0
1.0      5.0
10.0    10.0
dtype: float64

In [**]: ser.interpolate(method='values')
Out[**]:
0.0      0.0
1.0      1.0
10.0    10.0
dtype: float64
Similarly, you can interpolate the data frame.
In [**]: df = pd.DataFrame({'A': [1, 2.1, np.nan, 4.7, 5.6, 6.8],
   ....:                    'B': [.25, np.nan, np.nan, 4, 12.2, 14.4]})
   ....:

In [**]: df
Out[**]:
     A      B
0  1.0   0.25
1  2.1    NaN
2  NaN    NaN
3  4.7   4.00
4  5.6  12.20
5  6.8  14.40

In [**]: df.interpolate()
Out[**]:
     A      B
0  1.0   0.25
1  2.1   1.50
2  3.4   2.75
3  4.7   4.00
4  5.6  12.20
5  6.8  14.40
You can perform more advanced interpolation by using the method argument. If you have scipy installed, you can pass the name of the one-dimensional interpolation routine to method. For more information, see Documentation and Reference Guide Regarding interpolation of scipy. See org / doc / scipy / reference / tutorial / interpolate.html). The appropriate interpolation method depends on the type of data you are working with.
--When dealing with time series with high growth rates, method ='quadratic' may be appropriate.
--For values that approximate the cumulative distribution function, method ='pchip' should work.
--Consider method ='akima' to fill in missing values for a smooth plot.
: warning: ** Warning ** These methods require
scipy.
In [**]: df.interpolate(method='barycentric')
Out[**]:
      A       B
0  1.00   0.250
1  2.10  -7.660
2  3.53  -4.515
3  4.70   4.000
4  5.60  12.200
5  6.80  14.400

In [**]: df.interpolate(method='pchip')
Out[**]:
         A          B
0  1.00000   0.250000
1  2.10000   0.672808
2  3.43454   1.928950
3  4.70000   4.000000
4  5.60000  12.200000
5  6.80000  14.400000

In [**]: df.interpolate(method='akima')
Out[**]:
          A          B
0  1.000000   0.250000
1  2.100000  -0.873316
2  3.406667   0.320034
3  4.700000   4.000000
4  5.600000  12.200000
5  6.800000  14.400000
When interpolating with a polynomial or spline approximation, you must also specify the degree of the approximation.
In [**]: df.interpolate(method='spline', order=2)
Out[**]:
          A          B
0  1.000000   0.250000
1  2.100000  -0.428598
2  3.404545   1.206900
3  4.700000   4.000000
4  5.600000  12.200000
5  6.800000  14.400000

In [**]: df.interpolate(method='polynomial', order=2)
Out[**]:
          A          B
0  1.000000   0.250000
1  2.100000  -2.703846
2  3.451351  -1.453846
3  4.700000   4.000000
4  5.600000  12.200000
5  6.800000  14.400000
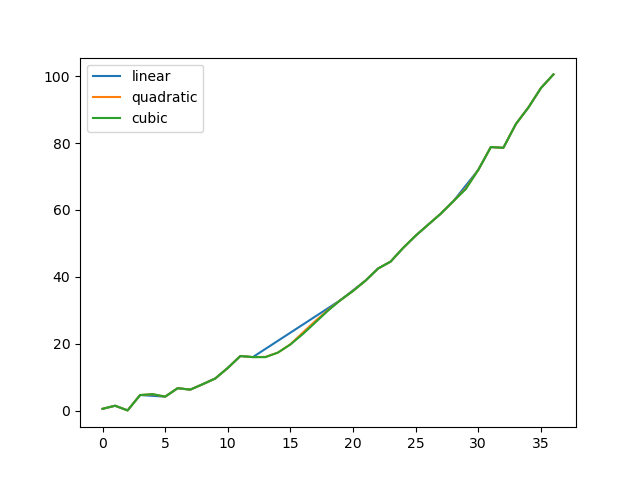
Let's compare several methods.
In [**]: np.random.seed(2)

In [**]: ser = pd.Series(np.arange(1, 10.1, .25) ** 2 + np.random.randn(37))

In [**]: missing = np.array([4, 13, 14, 15, 16, 17, 18, 20, 29])

In [**]: ser[missing] = np.nan

In [**]: methods = ['linear', 'quadratic', 'cubic']

In [**]: df = pd.DataFrame({m: ser.interpolate(method=m) for m in methods})

In [**]: df.plot()
Out[**]: <matplotlib.axes._subplots.AxesSubplot at 0x7fc18e5b6c70>
Another use case is interpolation with new values. Suppose you have 100 observations from a distribution. And let's say you're particularly interested in what's happening near the center. You can interpolate with new values by combining the reindex and ʻinterpolate` methods of pandas.
In [**]: ser = pd.Series(np.sort(np.random.uniform(size=100)))

#Interpolation for new index
In [**]: new_index = ser.index | pd.Index([49.25, 49.5, 49.75, 50.25, 50.5, 50.75])

In [**]: interp_s = ser.reindex(new_index).interpolate(method='pchip')

In [**]: interp_s[49:51]
Out[**]:
49.00    0.471410
49.25    0.476841
49.50    0.481780
49.75    0.485998
50.00    0.489266
50.25    0.491814
50.50    0.493995
50.75    0.495763
51.00    0.497074
dtype: float64
Interpolation limits
Like other pandas fill-in-the-blank methods, [interpolate ()](https://pandas.pydata.org/pandas-docs/stable/reference/api/pandas.DataFrame.interpolate.html#pandas.DataFrame .interpolate) </ code> takes the keyword argument limit. You can use this argument to limit the number of consecutive NaN values that have been entered since the last valid observation.
In [**]: ser = pd.Series([np.nan, np.nan, 5, np.nan, np.nan,
   ....:                  np.nan, 13, np.nan, np.nan])
   ....:

In [**]: ser
Out[**]:
0     NaN
1     NaN
2     5.0
3     NaN
4     NaN
5     NaN
6    13.0
7     NaN
8     NaN
dtype: float64

#Fill all values in a row forward
In [**]: ser.interpolate()
Out[**]:
0     NaN
1     NaN
2     5.0
3     7.0
4     9.0
5    11.0
6    13.0
7    13.0
8    13.0
dtype: float64

#Fill only one value forward
In [**]: ser.interpolate(limit=1)
Out[**]:
0     NaN
1     NaN
2     5.0
3     7.0
4     NaN
5     NaN
6    13.0
7    13.0
8     NaN
dtype: float64
By default, the NaN value is filled forward. Use the limit_direction parameter to fill holes from behind or from both directions.
#Fill one hole backward
In [**]: ser.interpolate(limit=1, limit_direction='backward')
Out[**]:
0     NaN
1     5.0
2     5.0
3     NaN
4     NaN
5    11.0
6    13.0
7     NaN
8     NaN
dtype: float64

#Fill one hole in both directions
In [**]: ser.interpolate(limit=1, limit_direction='both')
Out[**]:
0     NaN
1     5.0
2     5.0
3     7.0
4     NaN
5    11.0
6    13.0
7    13.0
8     NaN
dtype: float64

#Fill all values that are consecutive in both directions
In [**]: ser.interpolate(limit_direction='both')
Out[**]:
0     5.0
1     5.0
2     5.0
3     7.0
4     9.0
5    11.0
6    13.0
7    13.0
8    13.0
dtype: float64
By default, the NaN value is filled inside (enclosed) the existing valid value or outside the existing valid value. The limit_area parameter introduced in v0.23 limits input to internal or external values.
#Fill one continuous inner value in both directions
In [**]: ser.interpolate(limit_direction='both', limit_area='inside', limit=1)
Out[**]:
0     NaN
1     NaN
2     5.0
3     7.0
4     NaN
5    11.0
6    13.0
7     NaN
8     NaN
dtype: float64

#Fill all consecutive outer values in the opposite direction
In [**]: ser.interpolate(limit_direction='backward', limit_area='outside')
Out[**]:
0     5.0
1     5.0
2     5.0
3     NaN
4     NaN
5     NaN
6    13.0
7     NaN
8     NaN
dtype: float64

#Fill all outer values that are continuous in both directions
In [**]: ser.interpolate(limit_direction='both', limit_area='outside')
Out[**]:
0     5.0
1     5.0
2     5.0
3     NaN
4     NaN
5     NaN
6    13.0
7    13.0
8    13.0
dtype: float64
General value replacement
Often you want to replace any value with another.
Series replace () </ code> and Dataframe replace () </ code> Allows you to perform such replacements efficiently and flexibly.
For series, you can replace a single value or a list of values with another value.
In [**]: ser = pd.Series([0., 1., 2., 3., 4.])

In [**]: ser.replace(0, 5)
Out[**]:
0    5.0
1    1.0
2    2.0
3    3.0
4    4.0
dtype: float64
You can replace the list of values with a list of other values.
In [**]: ser.replace([0, 1, 2, 3, 4], [4, 3, 2, 1, 0])
Out[**]:
0    4.0
1    3.0
2    2.0
3    1.0
4    0.0
dtype: float64
You can also specify a mapping dictionary.
In [**]: ser.replace({0: 10, 1: 100})
Out[**]:
0     10.0
1    100.0
2      2.0
3      3.0
4      4.0
dtype: float64
For data frames, you can specify a separate value for each column.
In [**]: df = pd.DataFrame({'a': [0, 1, 2, 3, 4], 'b': [5, 6, 7, 8, 9]})

In [**]: df.replace({'a': 0, 'b': 5}, 100)
Out[**]:
     a    b
0  100  100
1    1    6
2    2    7
3    3    8
4    4    9
Instead of replacing with the specified value, you can treat all the specified values as missing values and interpolate them.
In [**]: ser.replace([1, 2, 3], method='pad')
Out[**]:
0    0.0
1    0.0
2    0.0
3    0.0
4    4.0
dtype: float64
Replacing strings and regular expressions
: information_source: ** Note ** Python strings preceded by
r, such asr'hello world', are so-called "raw" strings. They have different backslash semantics than unprefixed strings. Backslashes in the raw string are interpreted as escaped backslashes (for example,r'\'=='\\'). If you're not sure about this, you should read about this (https://docs.python.org/3/reference/lexical_analysis.html#string-literals).
Replace "." With NaN (string → string).
In [**]: d = {'a': list(range(4)), 'b': list('ab..'), 'c': ['a', 'b', np.nan, 'd']}

In [**]: df = pd.DataFrame(d)

In [**]: df.replace('.', np.nan)
Out[**]:
   a    b    c
0  0    a    a
1  1    b    b
2  2  NaN  NaN
3  3  NaN    d
Next, use a regular expression to remove the surrounding whitespace (regular expression-> regular expression).
In [**]: df.replace(r'\s*\.\s*', np.nan, regex=True)
Out[**]:
   a    b    c
0  0    a    a
1  1    b    b
2  2  NaN  NaN
3  3  NaN    d
Replace some different values (list → list).
In [**]: df.replace(['a', '.'], ['b', np.nan])
Out[**]:
   a    b    c
0  0    b    b
1  1    b    b
2  2  NaN  NaN
3  3  NaN    d
List of regular expressions → List of regular expressions.
In [**]: df.replace([r'\.', r'(a)'], ['dot', r'\1stuff'], regex=True)
Out[**]:
   a       b       c
0  0  astuff  astuff
1  1       b       b
2  2     dot     NaN
3  3     dot       d
Search only column 'b' (Dictionary → Dictionary).
In [**]: df.replace({'b': '.'}, {'b': np.nan})
Out[**]:
   a    b    c
0  0    a    a
1  1    b    b
2  2  NaN  NaN
3  3  NaN    d
Same as the previous example, but instead use a regular expression for the search (regular expression dictionary → dictionary).
In [**]: df.replace({'b': r'\s*\.\s*'}, {'b': np.nan}, regex=True)
Out[**]:
   a    b    c
0  0    a    a
1  1    b    b
2  2  NaN  NaN
3  3  NaN    d
You can use regex = True to pass a nested dictionary of regular expressions.
In [**]: df.replace({'b': {'b': r''}}, regex=True)
Out[**]:
   a  b    c
0  0  a    a
1  1       b
2  2  .  NaN
3  3  .    d
Alternatively, you can pass a nested dictionary as follows:
In [**]: df.replace(regex={'b': {r'\s*\.\s*': np.nan}})
Out[**]:
   a    b    c
0  0    a    a
1  1    b    b
2  2  NaN  NaN
3  3  NaN    d
You can also replace using a group of regular expression matches (Regular Expression Dictionary → Regular Expression Dictionary). This also works for lists.
In [**]: df.replace({'b': r'\s*(\.)\s*'}, {'b': r'\1ty'}, regex=True)
Out[**]:
   a    b    c
0  0    a    a
1  1    b    b
2  2  .ty  NaN
3  3  .ty    d
You can pass a list of regular expressions, and any matches will be replaced with a scalar (list of regular expressions-> regular expressions).
In [**]: df.replace([r'\s*\.\s*', r'a|b'], np.nan, regex=True)
Out[**]:
   a   b    c
0  0 NaN  NaN
1  1 NaN  NaN
2  2 NaN  NaN
3  3 NaN    d
You can also pass the to_replace argument as the regex argument for all regular expression examples. In this case, the value argument must be explicitly passed by name, or the regex must be a nested dictionary. The previous example in this case looks like this:
In [**]: df.replace(regex=[r'\s*\.\s*', r'a|b'], value=np.nan)
Out[**]:
   a   b    c
0  0 NaN  NaN
1  1 NaN  NaN
2  2 NaN  NaN
3  3 NaN    d
This is useful if you don't want to pass regex = True every time you use a regular expression.
In the
replaceexample above, wherever you can pass a regular expression, passing a compiled regular expression is just as valid.
Numerical replacement
replace () </ code> is > Similar to fillna () </ code>.
In [**]: df = pd.DataFrame(np.random.randn(10, 2))

In [**]: df[np.random.rand(df.shape[0]) > 0.5] = 1.5

In [**]: df.replace(1.5, np.nan)
Out[**]:
          0         1
0 -0.844214 -1.021415
1  0.432396 -0.323580
2  0.423825  0.799180
3  1.262614  0.751965
4       NaN       NaN
5       NaN       NaN
6 -0.498174 -1.060799
7  0.591667 -0.183257
8  1.019855 -1.482465
9       NaN       NaN
You can replace multiple values by passing a list.
In [**]: df00 = df.iloc[0, 0]

In [**]: df.replace([1.5, df00], [np.nan, 'a'])
Out[**]:
          0         1
0         a  -1.02141
1  0.432396  -0.32358
2  0.423825   0.79918
3   1.26261  0.751965
4       NaN       NaN
5       NaN       NaN
6 -0.498174   -1.0608
7  0.591667 -0.183257
8   1.01985  -1.48247
9       NaN       NaN

In [**]: df[1].dtype
Out[**]: dtype('float64')
You can also process the data frame in-place.
In [**]: df.replace(1.5, np.nan, inplace=True)
: warning: ** Warning ** When replacing multiple
boolordatetime64objects, the first argument ofreplace(to_replace) must match the type of the value to be replaced. For example>>> s = pd.Series([True, False, True]) >>> s.replace({'a string': 'new value', True: False}) # raises TypeError: Cannot compare types 'ndarray(dtype=bool)' and 'str'A
TypeErroroccurs because one of thedictkeys is not a suitable type for substitution.However, if you want to replace a * single * object like this:
In [**]: s = pd.Series([True, False, True])

In [**]: s.replace('a string', 'another string')
Out[**]:
0     True
1    False
2     True
dtype: bool
The original
NDFrameobject is returned as is. We are currently working on integrating this API, but for backwards compatibility reasons we can't break the latter behavior. For more information, see GH6354.
Missing data cast rules and indexing
Pandas supports storing integer and Boolean arrays, but these types cannot store missing data. Until NumPy switched to using native NA types, we had some "cast rules" in place. If the reindexing operation results in missing data, the series will be cast according to the rules presented in the table below.
| Data type | Cast destination |
|---|---|
| integer | Floating point |
| Boolean value | object |
| Floating point | Do not cast |
| object | Do not cast |
For example
In [**]: s = pd.Series(np.random.randn(5), index=[0, 2, 4, 6, 7])

In [**]: s > 0
Out[**]:
0    True
2    True
4    True
6    True
7    True
dtype: bool

In [**]: (s > 0).dtype
Out[**]: dtype('bool')

In [**]: crit = (s > 0).reindex(list(range(8)))

In [**]: crit
Out[**]:
0    True
1     NaN
2    True
3     NaN
4    True
5     NaN
6    True
7    True
dtype: object

In [**]: crit.dtype
Out[**]: dtype('O')
NumPy usually complains when trying to get or set a value from an ndarray using an object array instead of a boolean array (for example, choosing a value based on some criteria). An exception is thrown if the boolean vector contains NA.
In [**]: reindexed = s.reindex(list(range(8))).fillna(0)

In [**]: reindexed[crit]
---------------------------------------------------------------------------
ValueError                                Traceback (most recent call last)
<ipython-input-138-0dac417a4890> in <module>
----> 1 reindexed[crit]

~/work/pandas/pandas/pandas/core/series.py in __getitem__(self, key)
    901             key = list(key)
    902
--> 903         if com.is_bool_indexer(key):
    904             key = check_bool_indexer(self.index, key)
    905             key = np.asarray(key, dtype=bool)

~/work/pandas/pandas/pandas/core/common.py in is_bool_indexer(key)
    132                 na_msg = "Cannot mask with non-boolean array containing NA / NaN values"
    133                 if isna(key).any():
--> 134                     raise ValueError(na_msg)
    135                 return False
    136             return True

ValueError: Cannot mask with non-boolean array containing NA / NaN values
However, these are fillna () </ code Fill in the holes with> and it works fine.
In [**]: reindexed[crit.fillna(False)]
Out[**]:
0    0.126504
2    0.696198
4    0.697416
6    0.601516
7    0.003659
dtype: float64

In [**]: reindexed[crit.fillna(True)]
Out[**]:
0    0.126504
1    0.000000
2    0.696198
3    0.000000
4    0.697416
5    0.000000
6    0.601516
7    0.003659
dtype: float64
Pandas provides an integer data type that can have missing values, but you must explicitly specify it when creating a series or column. Note that we are using an uppercase "I" in dtype =" Int64 ".
In [**]: s = pd.Series([0, 1, np.nan, 3, 4], dtype="Int64")

In [**]: s
Out[**]:
0       0
1       1
2    <NA>
3       3
4       4
dtype: Int64
See Missing Integer Data Types for more information.
Experimental NA scalar to show missing values
: warning: ** Warning ** Test operation: The behavior of
pd.NAis subject to change without warning.
_ From version 1.0.0 _
Starting with pandas 1.0, an experimental value pd.NA (singleton) is available to represent scalar missing values. Currently, nullable integer, boolean, and dedicated string data types are used as missing value indicators.
Starting with pandas 1.0, experimental pd.NA values (singletons) can be used to represent scalar missing values. Currently missing integers, booleans, and [dedicated strings](https: // qiita.com/nkay/items/3866b3f12704ec3271ca # Text data type) It is used as a missing value indicator in the data type.
The purpose of pd.NA is to provide" missing "values that can be used consistently across data types (instead of np.nan, None, and pd.NaT depending on the data type. To).
For example, if there are missing values in a series of missing integer data types, pd.NA is used.
In [**]: s = pd.Series([1, 2, None], dtype="Int64")

In [**]: s
Out[**]:
0       1
1       2
2    <NA>
dtype: Int64

In [**]: s[2]
Out[**]: <NA>

In [**]: s[2] is pd.NA
Out[**]: True
Currently, pandas doesn't use these data types by default (when creating or reading data frames or series), so you need to explicitly specify the data types. An easy way to convert to these data types is described here (# conversion).
Propagation in arithmetic and comparison operations
In general, operations involving pd.NA propagate missing values. If one of the operands is unknown, the result of the operation is also unknown.
For example, pd.NA propagates arithmetically like np.nan.
In [**]: pd.NA + 1
Out[**]: <NA>

In [**]: "a" * pd.NA
Out[**]: <NA>
Even if one of the operands is NA, there are some special cases if the result is known.
In [**]: pd.NA ** 0
Out[**]: 1

In [**]: 1 ** pd.NA
Out[**]: 1
The equality and comparison operations also propagate pd.NA. This is different from the behavior of np.nan, where the comparison result is always False.
In [**]: pd.NA == 1
Out[**]: <NA>

In [**]: pd.NA == pd.NA
Out[**]: <NA>

In [**]: pd.NA < 2.5
Out[**]: <NA>
To find out if the value is equal to pd.NA, [isna ()](https://pandas.pydata.org/pandas-docs/stable/reference/api/pandas.isna.html Use the # pandas.isna) </ code> function.
In [**]: pd.isna(pd.NA)
Out[**]: True
The exception to this basic propagation rule is * reduction * (like mean and minimum), which pandas skips missing values by default. See [above](## Calculation for missing data) for details.
Logical operation
For logical operations, pd.NA is [three-valued logic](https://ja.wikipedia.org/wiki/3-valued logic) (also called Kleene's logic, which behaves like R / SQL / Julia) Follow the rules of. This logic means propagating missing values only when logically needed.
For example, in the case of the logical operation "or" (|), if one of the operands is True, it is False regardless of the other value (that is, even if the missing value is True". Also), we already know that the result will be True. In this case, pd.NA will not propagate.
In [**]: True | False
Out[**]: True

In [**]: True | pd.NA
Out[**]: True

In [**]: pd.NA | True
Out[**]: True
On the other hand, if one of the operands is False, the result depends on the value of the other operand. Therefore, in this case, pd.NA will propagate.
In [**]: False | True
Out[**]: True

In [**]: False | False
Out[**]: False

In [**]: False | pd.NA
Out[**]: <NA>
The behavior of the logical operation "and" (&) can also be derived using similar logic (in this case, pd.NA if one of the operands is already False. Does not propagate).
In [**]: False & True
Out[**]: False

In [**]: False & False
Out[**]: False

In [**]: False & pd.NA
Out[**]: False
In [**]: True & True
Out[**]: True

In [**]: True & False
Out[**]: False

In [**]: True & pd.NA
Out[**]: <NA>
NA in Boolean context
Missing values cannot be converted to Boolean values because the actual value is unknown. The following will result in an error.
In [**]: bool(pd.NA)
---------------------------------------------------------------------------
TypeError                                 Traceback (most recent call last)
<ipython-input-167-5477a57d5abb> in <module>
----> 1 bool(pd.NA)

~/work/pandas/pandas/pandas/_libs/missing.pyx in pandas._libs.missing.NAType.__bool__()

TypeError: boolean value of NA is ambiguous
This also means that in a context where pd.NA is evaluated with a Boolean value, for example ʻif condition: ..., condition can be pd.NA. NA means that it cannot be used. In this case, use isna () </ code> You can use it to check pd.NA or, for example, pre-fill the missing values to avoid the condition being pd.NA.
A similar situation occurs when using series or dataframe objects in ʻif` statements. See Use if / Truth statements with pandas (https://pandas.pydata.org/pandas-docs/stable/user_guide/gotchas.html#gotchas-truth).
NumPy ufunc
pandas.NA implements NumPy's __array_ufunc__ protocol. Most ufunc works for NA and generally returns NA.
In [**]: np.log(pd.NA)
Out[**]: <NA>

In [**]: np.add(pd.NA, 1)
Out[**]: <NA>
: warning: ** Warning ** Currently, ufunc with ndarray and
NAreturns an object data type filled with missing values.In [**]: a = np.array([1, 2, 3]) In [**]: np.greater(a, pd.NA) Out[**]: array([<NA>, <NA>, <NA>], dtype=object)The return type here may change to return a different array type in the future.
For more information on ufunc, see DataFrame and NumPy Function Interoperability (https://pandas.pydata.org/pandas-docs/stable/user_guide/dsintro.html#dsintro-numpy-interop). ..
conversion
If you have a data frame or series that uses traditional types and you have data that isn't represented using np.nan, the series will have [convert_dtypes ()](https: //). pandas.pydata.org/pandas-docs/stable/reference/api/pandas.Series.convert_dtypes.html#pandas.Series.convert_dtypes) </ code>, but convert_dtypes () in the data frame There is //pandas.pydata.org/pandas-docs/stable/reference/api/pandas.DataFrame.convert_dtypes.html#pandas.DataFrame.convert_dtypes) </ code> and [here](https://pandas. You can convert your data to use the new data types for integers, strings, and bourians listed in pydata.org/pandas-docs/stable/user_guide/basics.html#basics-dtypes). This is read_csv () after loading the dataset. For readers such as code> and read_excel () </ code> This is especially useful for guessing the default data type.
In this example, the data types of all columns have changed, but the results for the first 10 columns are shown.
In [**]: bb = pd.read_csv('data/baseball.csv', index_col='id')

In [**]: bb[bb.columns[:10]].dtypes
Out[**]:
player    object
year       int64
stint      int64
team      object
lg        object
g          int64
ab         int64
r          int64
h          int64
X2b        int64
dtype: object
In [**]: bbn = bb.convert_dtypes()

In [**]: bbn[bbn.columns[:10]].dtypes
Out[**]:
player    string
year       Int64
stint      Int64
team      string
lg        string
g          Int64
ab         Int64
r          Int64
h          Int64
X2b        Int64
dtype: object
Recommended Posts