I tried the new feature profiler of IntelliJ IDEA 2019.2.
New features of IntelliJ IDEA 2019 \ .2 \ | Samuraism Co., Ltd.
This new feature is gorgeous!
I often improve performance, but IntelliJ IDEA also has a profiling tool, so I tried using it. It seemed convenient, so it looks like this will be the main weapon in the future.
Assumptions: Ubuntu 19.04, Scala (can also be Java)
Setting method
Press + as shown below to add a set of profilers and press OK
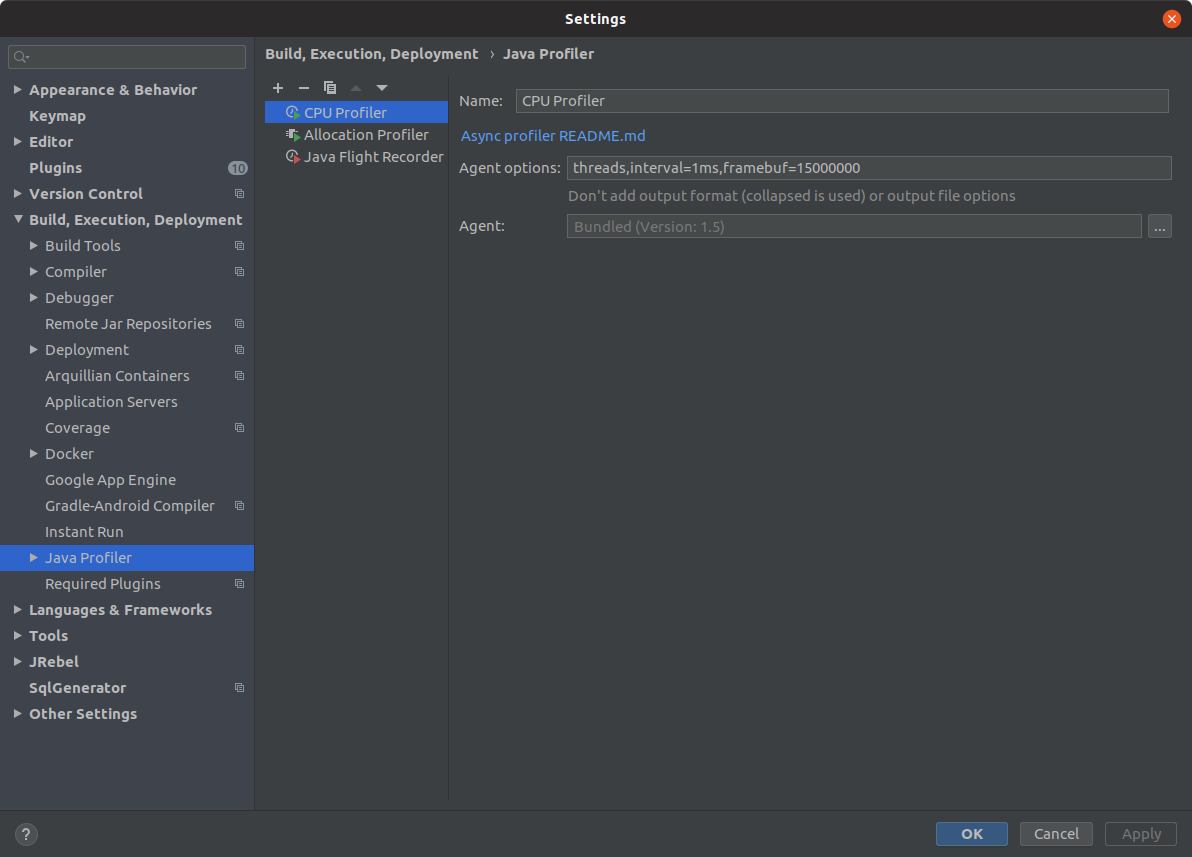
Then, there are more menus when executing, so for the time being, try pressing Run'somehow' with'Profiler'
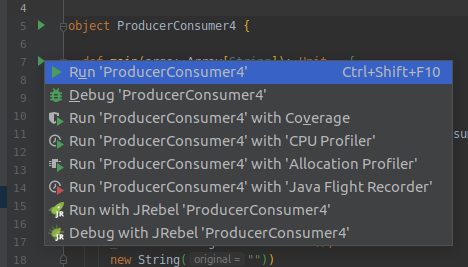
↓ modal will come out, so
 As instructed
sudo sh -c 'echo 1 > /proc/sys/kernel/perf_event_paranoid'
sudo sh -c 'echo 0 > /proc/sys/kernel/kptr_restrict'
Execute. Upon examination, this setting seems to be necessary for collecting and analyzing information about kernel performance. If it is not Linux, it may not be necessary or another setting method may come out.
↓ Related article Chapter 52 Compilers and Tools -Red Hat Customer Portal Enable Linux \ * Kernel Analysis
I tried to profile
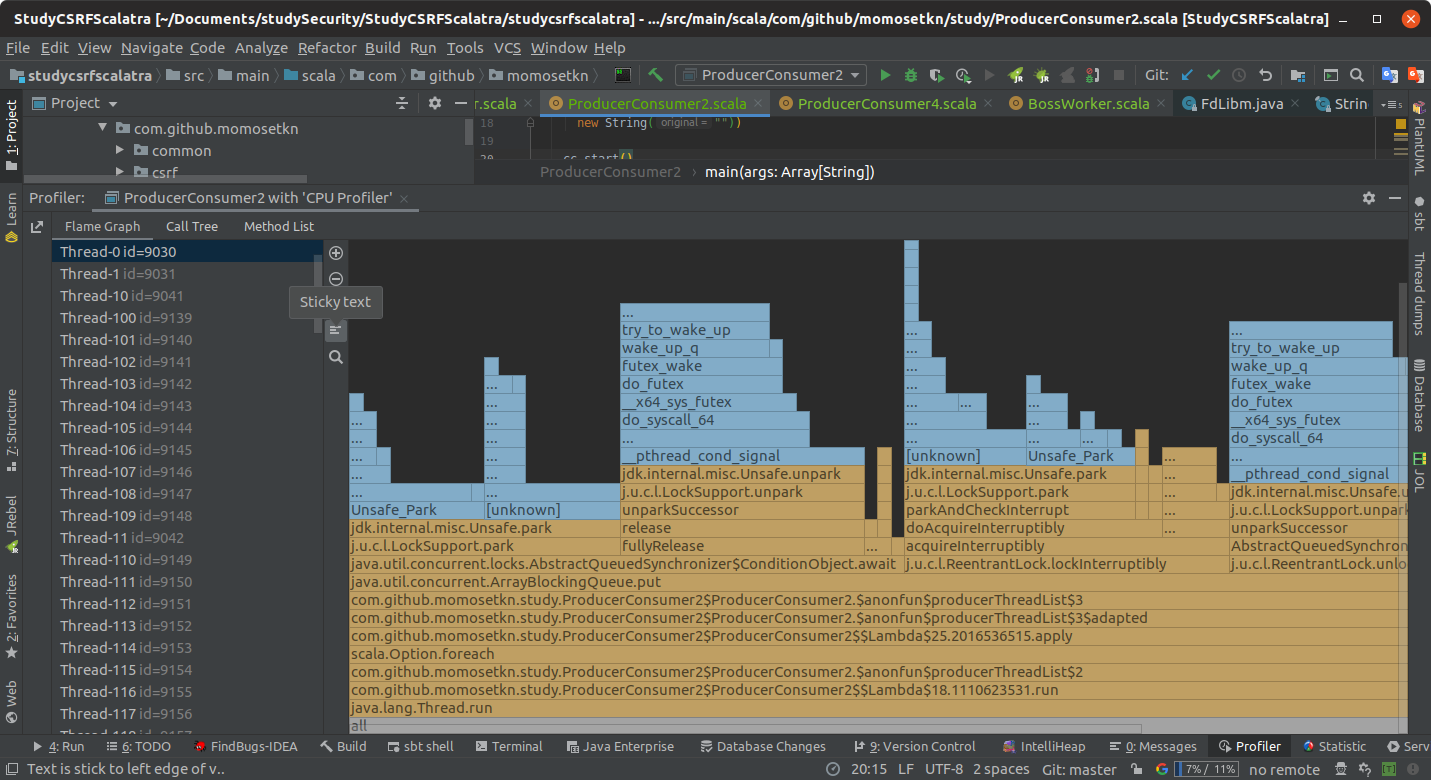
Frame Graph tab
Hmmm, maybe I don't use it much
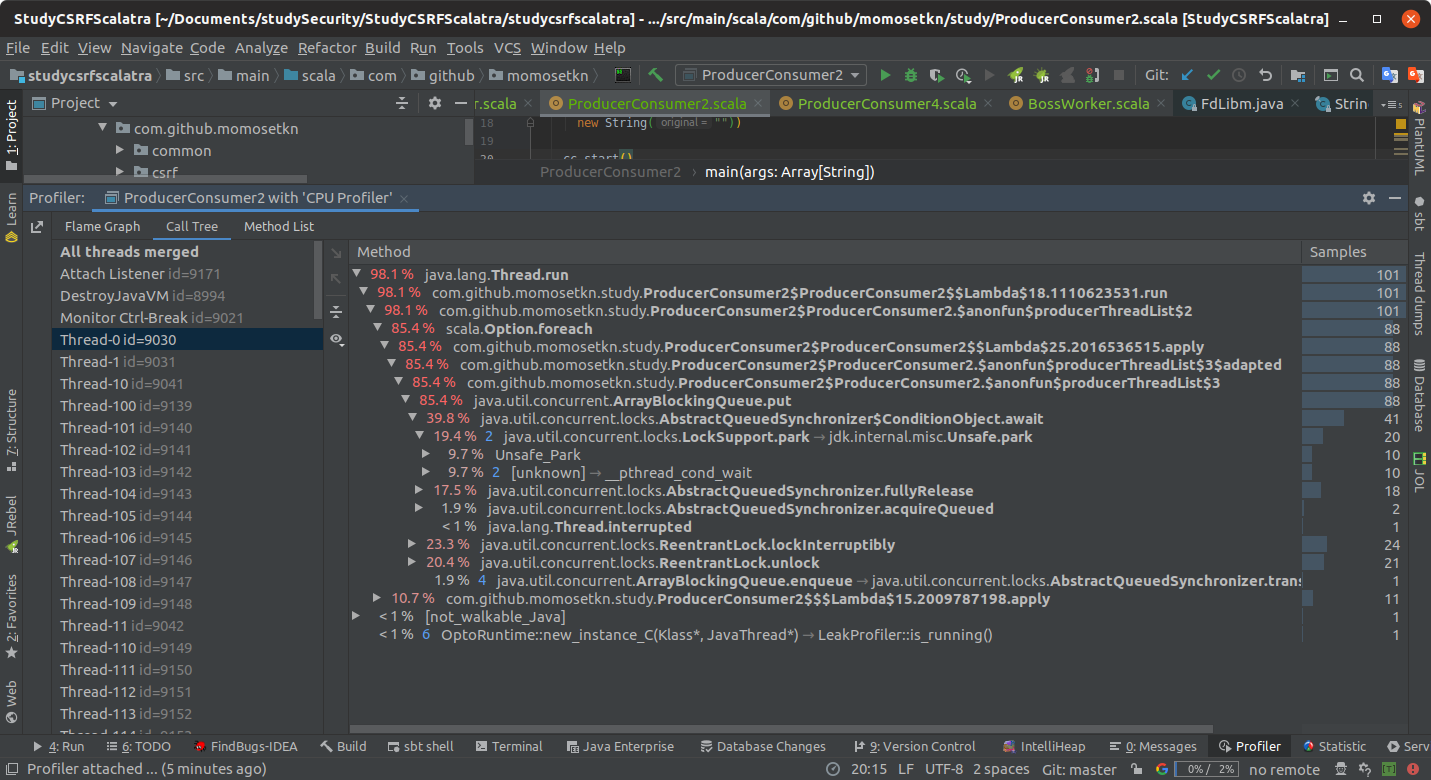
Call Tree
It became a tree and came out with% each.
If you profile with VisualVM, you will get something like this.
The blue number to the right of% seems to be the number of folded cases.
 Method List
It is now sorted in the order in which it was sampled.
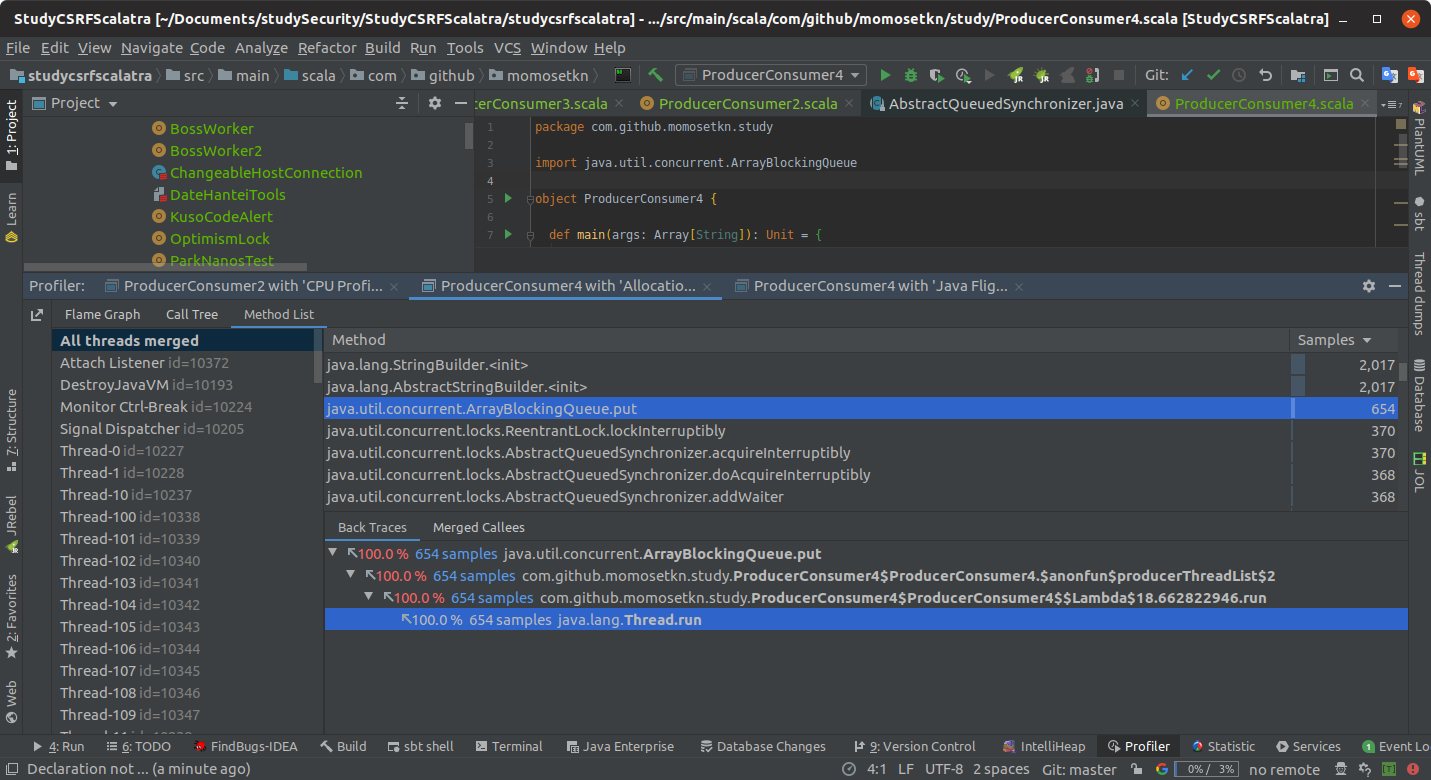
You can select the Back Trace tab and the Merged Callees tab from the selected method.
The Back Trace tab allows you to trace where it was called.
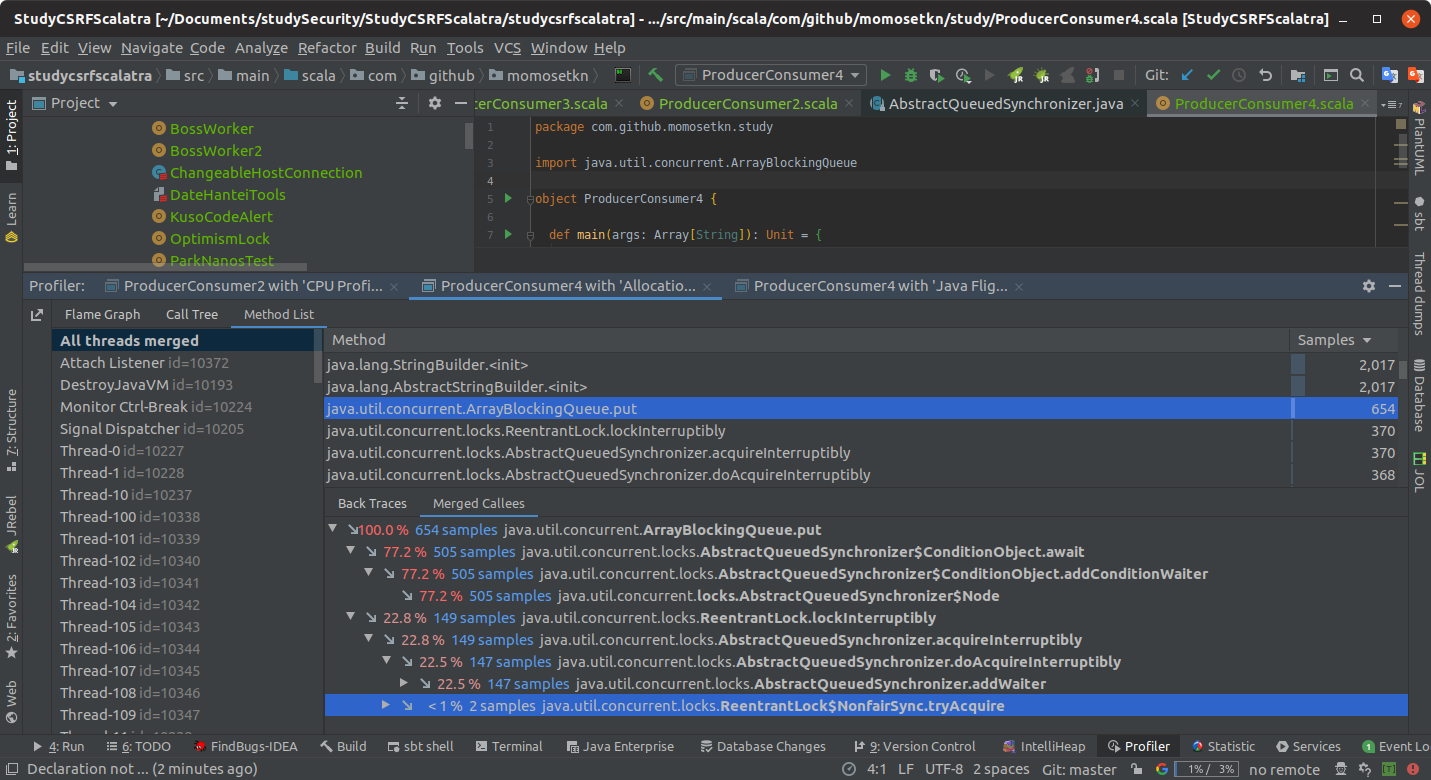
The Merged Callees tab looks like a method called within that method.
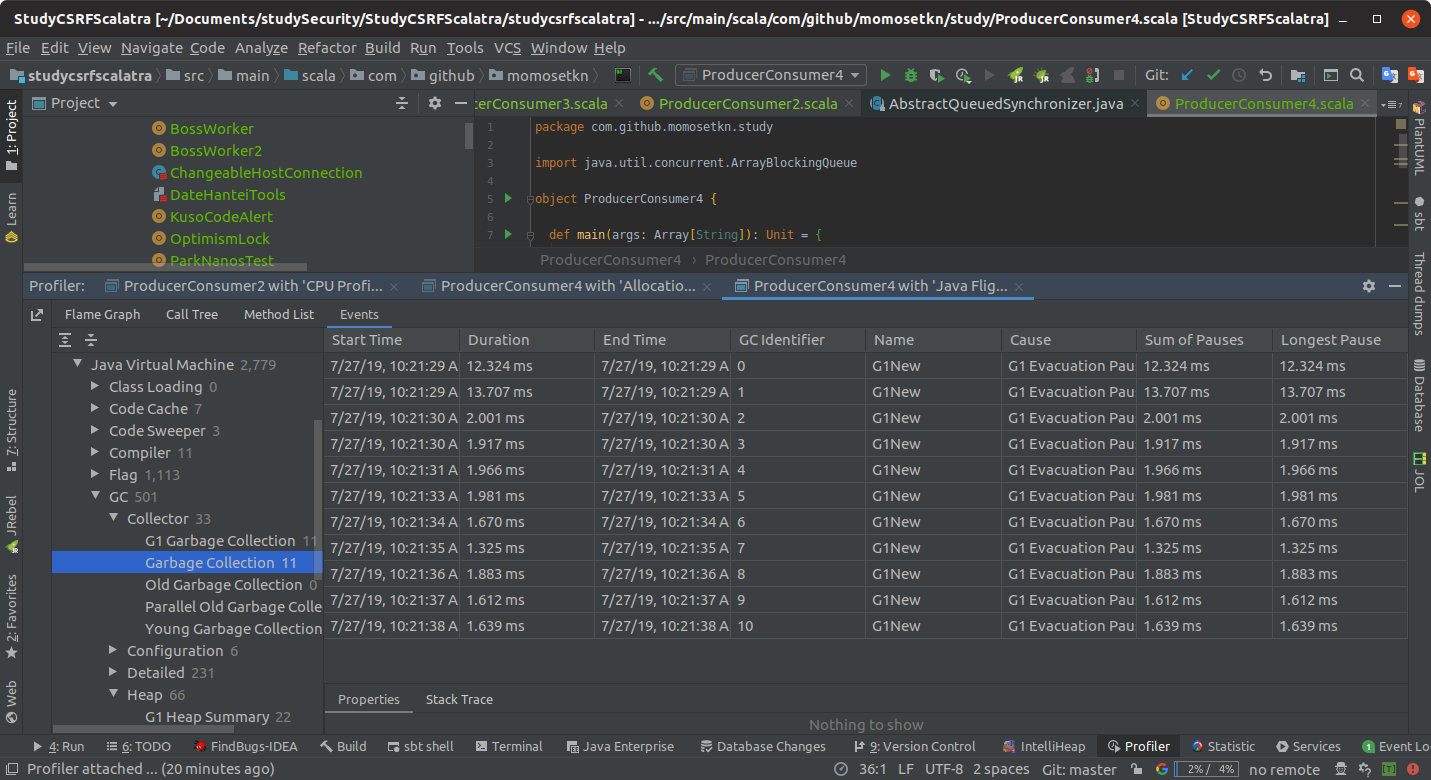
I also tried using Java Flight Recorder
There are various things such as GC logs and the number of weak references.
Recommended Posts