Create a standard normal distribution graph in Python
1. What is a standard normal distribution?
Normal distribution with mean μ = 0, variance σ = 1, That is, it is a function expressed by the following formula.
f(x) = \frac{1}{ \sqrt{2 \pi } } e^{- \frac{x^2}{2} }
2. Create your own standard normal distribution
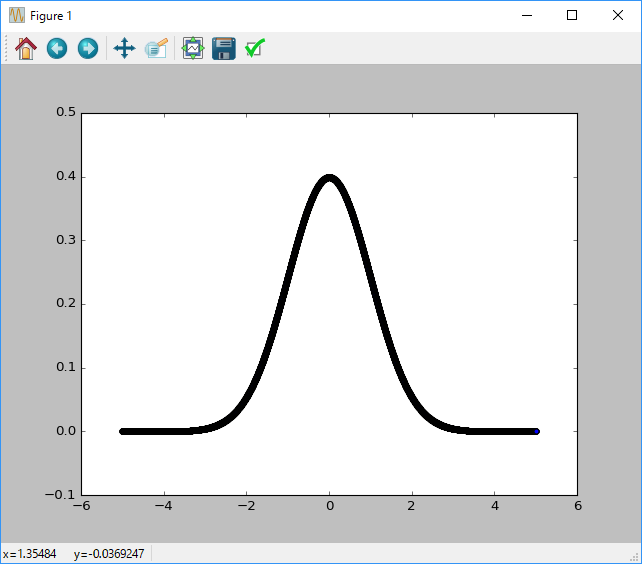
If you define the above f (x) yourself and try [-5.0, -4.999, -4.998, ..., 4.998, 4.999, 5.0] and the sequence of ~ 5.0 ~ 5.0, You will get a graph that is commonly called a normal distribution.
norm_original.py
# coding: utf-8
import numpy as np
import math

# f(x)Write by yourself
f = lambda x: (math.exp(-x**2/2)) / math.sqrt(2*math.pi)

#Vector x[-5.0, ..., 5.0]Created in the section of
n = np.linspace(-5.0, 5.0, 10000)

# f(x)Get the result of
p = []
for i in range(len(n)):
    p.append(f(n[i]))

#Display on graph
plt.scatter(n, p)
plt.show()

I got a beautiful bell, but it's a little annoying to define it one by one. Above all, it takes time when you want to change the mean or variance.
3. Use scipy
With the scipy.stats module In the above code (norm_original.py), the formula defined by the lambda expression can be called from the function.
norm_usescipy.py
# coding: utf-8
import matplotlib.pyplot as plt
import numpy as np
from scipy.stats import norm

#Vector x[-5.0, ..., 5.0]Created in the section of
n = np.linspace(-5.0, 5.0, 10000)

#Average 0,Find the probability of x in a normal distribution with a standard deviation of 1
p = []
for i in range(len(n)):
    p.append(norm.pdf(x=n[i], loc=0, scale=1))

#Create a graph of standard normal distribution by showing the characteristics of random numbers-probabilities in a scatter plot.
plt.scatter(n, p)
plt.show()
Since you can specify the mean and variance as arguments, you can easily obtain a different form of normal distribution.
4. Look at the simultaneous entropy from the cumulative distribution function
In the previous chapter, we used the probability density function of the normal distribution from scipy.stats.norm.pdf. Now let's play around with it a bit and use the cumulative distribution function of the normal distribution from scipy.stats.norm.cdf.
Wikipedia's [Joint Entropy](https://ja.wikipedia.org/wiki/%E7%B5%90%E5%90%88%E3%82%A8%E3%83%B3%E3%83%88% E3% 83% AD% E3% 83% 94% E3% 83% BC) I will write it referring to the description.
The simultaneous entropy (joint entropy) H (X) represents the uncertainty of the value of the random variable X. When the probability that event x belonging to X occurs is p (x), the entropy of X is
H(X) = - \sum_{x} p_x log_2 (p_x)
It is represented by.
Here, assuming that the probability is on the standard normal distribution, if the entropy is represented in a graph,
norm_usescipy.py
---p.append(norm.pdf(x=n[i], loc=0, scale=1))
+++p.append(norm.cdf(x=n[i], loc=0, scale=1))

You can get H (X) like this.
Recommended Posts