Draw a heart in Python
Overview
[Introduction to Mathematics Starting with Python](https://www.amazon.co.jp/Python%E3%81%8B%E3%82%89%E3%81%AF%E3%81%98%E3%82% I bought a book called 81% E3% 82% 8B% E6% 95% B0% E5% AD% A6% E5% 85% A5% E9% 96% 80-Amit-Saha / dp / 4873117682). Since it was a big deal, I decided to draw some graph while referring to "Chapter 2 Visualizing data with a graph". I liked the cute shapes, so I decided to draw: heart :.
First, create a configuration file for matplotlib as a preparation. It was necessary to specify backend to display the graph in the macOS environment, and font.family to use Japanese for the graph title.
~/.matplotlib/matplotlibrc
backend : TkAgg
font.family : Ricty Diminished
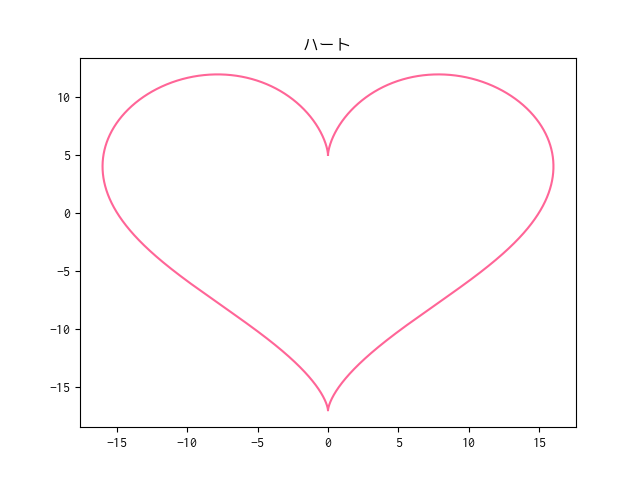
Now let's move on to the main subject of drawing: heart :. I used the formula on the page Heart Curve.
draw_heart.py
from matplotlib import pyplot as plt
from math import pi, sin, cos


def draw_graph(x, y, title, color):
  plt.title(title)
  plt.plot(x, y, color=color)
  plt.show()


# range()Floating point version of the function
# (reference)Getting Started with Mathematics Starting with Python 2.4.2.Generate 1 evenly spaced floating point numbers
def frange(start, final, increment=0.01):
  numbers = []

  while start < final:
    numbers.append(start)
    start = start + increment

  return numbers


def draw_heart():
  intervals = frange(0, 2 * pi)
  x = []
  y = []

  for t in intervals:
    x.append(16 * sin(t) ** 3)
    y.append(13 * cos(t) - 5 * cos(2 * t) - 2 * cos(3 * t) - cos(4 * t))

  draw_graph(x, y, title='heart', color='#FF6597')


if __name__ == '__main__':
  try:
    draw_heart()
  except KeyboardInterrupt:
    # control +Exit with C.
    pass
Running this Python script will draw a beautiful: heart: graph. Cute: relaxed:
bonus
The frange function implemented in the above script could be replaced with NumPy's arange function. NumPy also has functions such as pi, sin, and cos, so you don't even need the math module when using this module.
draw_heart.py
from matplotlib import pyplot as plt
from numpy import arange, pi, sin, cos


def draw_graph(x, y, title, color):
  plt.title(title)
  plt.plot(x, y, color=color)
  plt.show()


def draw_heart():
  intervals = arange(0, 2 * pi, 0.01)
  x = []
  y = []

  for t in intervals:
    x.append(16 * sin(t) ** 3)
    y.append(13 * cos(t) - 5 * cos(2 * t) - 2 * cos(3 * t) - cos(4 * t))

  draw_graph(x, y, title='heart', color='#FF6597')


if __name__ == '__main__':
  try:
    draw_heart()
  except KeyboardInterrupt:
    pass
Recommended Posts