[Python] How to draw a histogram in Matplotlib
Use hist to write a histogram in matplotlib. Some examples are shown below.
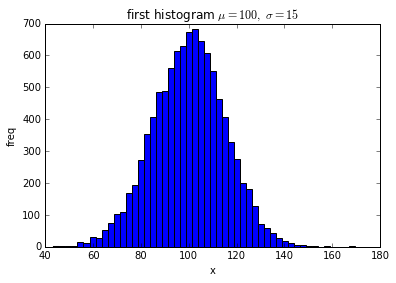
Simple histogram
Specify as hist (data, bins = number of bins). For title and label, use set_title, set_xlabel and set_ylabel as usual.
import numpy as np
import matplotlib.pyplot as plt

mu, sigma = 100, 15
x = mu + sigma * np.random.randn(10000)

fig = plt.figure()
ax = fig.add_subplot(1,1,1)

ax.hist(x, bins=50)
ax.set_title('first histogram $\mu=100,\ \sigma=15$')
ax.set_xlabel('x')
ax.set_ylabel('freq')
fig.show()
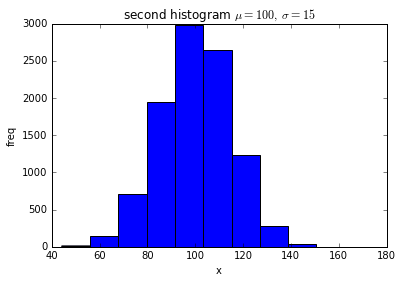
An example in which the number of bins is 10 (bins = 10).
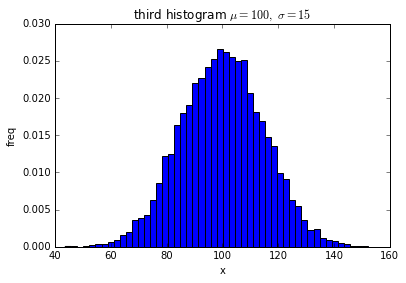
Normalize the histogram
Histogram is normalized when normed = True. At this time, the total frequency of each bin is 1.0.
import numpy as np
import matplotlib.pyplot as plt

mu, sigma = 100, 15
x = mu + sigma * np.random.randn(10000)

fig = plt.figure()
ax = fig.add_subplot(1,1,1)

ax.hist(x, bins=50, normed=True)
ax.set_title('third histogram $\mu=100,\ \sigma=15$')
ax.set_xlabel('x')
ax.set_ylabel('freq')
fig.show()
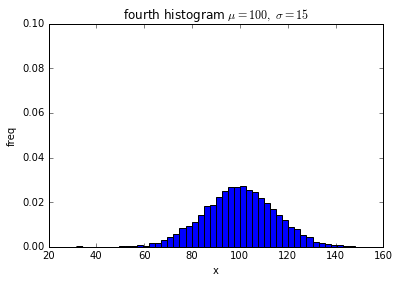
Fix the vertical axis
When comparing histograms, it may be convenient for the vertical axis to be fixed. In this case, set_ylim (min, max) should be used to fix the vertical axis. If set_ylim is not used, the vertical axis is adjusted so that the histogram is drawn exactly according to the frequency of the data.
import numpy as np
import matplotlib.pyplot as plt

mu, sigma = 100, 15
x = mu + sigma * np.random.randn(10000)

fig = plt.figure()
ax = fig.add_subplot(1,1,1)

ax.hist(x, bins=50, normed=True)
ax.set_title('fourth histogram $\mu=100,\ \sigma=15$')
ax.set_xlabel('x')
ax.set_ylabel('freq')
ax.set_ylim(0,0.1)
fig.show()
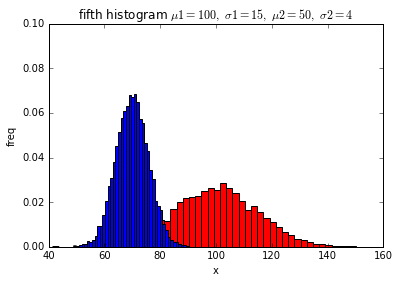
Draw two histograms on one graph
Simply call hist twice.
import numpy as np
import matplotlib.pyplot as plt

mu1, sigma1 = 100, 15
mu2, sigma2 = 70, 6
x1 = mu1 + sigma1 * np.random.randn(10000)
x2 = mu2 + sigma2 * np.random.randn(10000)

fig = plt.figure()
ax = fig.add_subplot(1,1,1)

ax.hist(x1, bins=50, normed=True, color='red')
ax.hist(x2, bins=50, normed=True, color='blue')
ax.set_title('fifth histogram $\mu1=100,\ \sigma1=15,\ \mu2=50,\ \sigma2=4$')
ax.set_xlabel('x')
ax.set_ylabel('freq')
ax.set_ylim(0,0.1)
fig.show()
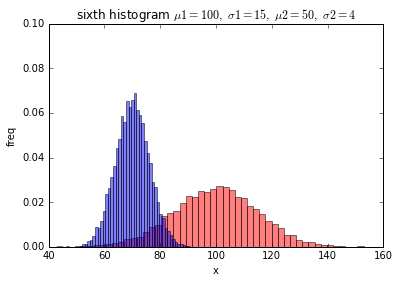
Make the graph translucent
When multiple histograms are written on one graph, the overlapping part is hidden. At this time, making the graph semi-transparent makes it a little easier to see. To make it translucent, set alpha = 0.5 as a parameter. At this time, if the value is set to alpha = 1.0, the graph becomes opaque and becomes the same as when alpha is not specified. When alpha = 0.0, the graph becomes transparent and completely invisible.
import numpy as np
import matplotlib.pyplot as plt

mu1, sigma1 = 100, 15
mu2, sigma2 = 70, 6
x1 = mu1 + sigma1 * np.random.randn(10000)
x2 = mu2 + sigma2 * np.random.randn(10000)

fig = plt.figure()
ax = fig.add_subplot(1,1,1)

ax.hist(x1, bins=50, normed=True, color='red', alpha=0.5)
ax.hist(x2, bins=50, normed=True, color='blue',alpha=0.5)
ax.set_title('sixth histogram $\mu1=100,\ \sigma1=15,\ \mu2=50,\ \sigma2=4$')
ax.set_xlabel('x')
ax.set_ylabel('freq')
ax.set_ylim(0,0.1)
fig.show()
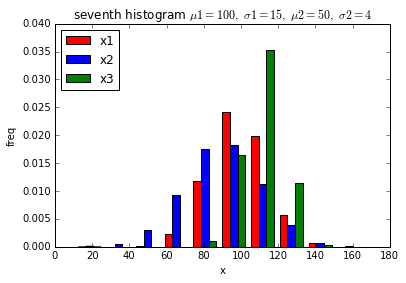
When you want to arrange the histograms side by side
When drawing multiple histograms on a single graph, you may want to arrange the Bars side by side in bin units for easy comparison. In this case, make the data a list like [x1, x2, x3] and make it like hist ([x1, x2, x3]). Make the color and label a list as well.
import numpy as np
import matplotlib.pyplot as plt

mu1, sigma1 = 100, 15
mu2, sigma2 = 90, 20
mu3, sigma3 = 110, 10
x1 = mu1 + sigma1 * np.random.randn(10000)
x2 = mu2 + sigma2 * np.random.randn(10000)
x3 = mu3 + sigma3 * np.random.randn(10000)

fig = plt.figure()
ax = fig.add_subplot(1,1,1)

ax.hist([x1, x2, x3], bins=10, normed=True, color=['red', 'blue', 'green'], label=['x1', 'x2', 'x3'])
ax.set_title('seventh histogram $\mu1=100,\ \sigma1=15,\ \mu2=50,\ \sigma2=4$')
ax.set_xlabel('x')
ax.set_ylabel('freq')
ax.legend(loc='upper left')
fig.show()
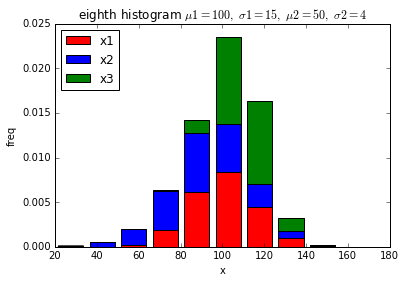
When you want to stack histograms vertically
When drawing multiple histograms on one graph, you may want to stack Bars vertically when you want to compare the total of three. In this case, the data should be hist ([x1, x2, x3]) as in the horizontal case, and the parameter should be stacked = True.
import numpy as np
import matplotlib.pyplot as plt

mu1, sigma1 = 100, 15
mu2, sigma2 = 90, 20
mu3, sigma3 = 110, 10
x1 = mu1 + sigma1 * np.random.randn(10000)
x2 = mu2 + sigma2 * np.random.randn(10000)
x3 = mu3 + sigma3 * np.random.randn(10000)

fig = plt.figure()
ax = fig.add_subplot(1,1,1)

ax.hist([x1, x2, x3], bins=10, normed=True, color=['red', 'blue', 'green'], label=['x1', 'x2', 'x3'], histtype='bar', stacked=True)
ax.set_title('eighth histogram $\mu1=100,\ \sigma1=15,\ \mu2=50,\ \sigma2=4$')
ax.set_xlabel('x')
ax.set_ylabel('freq')
ax.legend(loc='upper left')
fig.show()
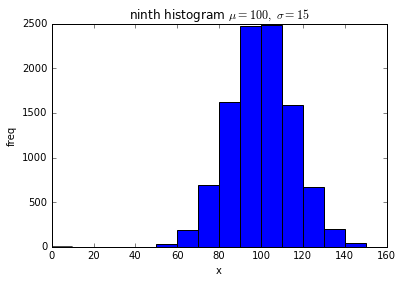
If you want to specify the bin spacing yourself
If you specify the number of bins, the bin spacing is automatically determined according to the maximum and minimum values of the data. There are times when you want to decide the bin spacing yourself without depending on the data, such as when you want to create a histogram within the range where the data can be taken. In that case, create a list of edges of bins and specify bins = edges in the parameter. The edge of a bin refers to the lower limit value or the upper limit value of the bin. For example, when the number of bins is 10, the number of edges is 11.
import numpy as np
import matplotlib.pyplot as plt

mu, sigma = 100, 15
x = mu + sigma * np.random.randn(10000)

fig = plt.figure()
ax = fig.add_subplot(1,1,1)
edges = range(0,160,10)
n, bins, patches = ax.hist(x, bins=edges)
ax.set_title('ninth histogram $\mu=100,\ \sigma=15$')
ax.set_xlabel('x')
ax.set_ylabel('freq')
fig.show()
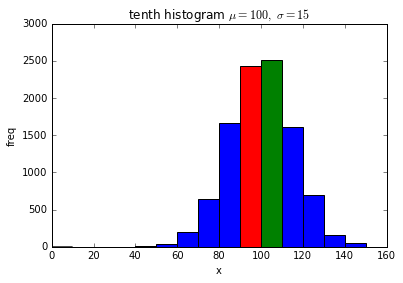
When you want to get histogram data
If you want to draw the graph and acquire the frequency data of the histogram at that time at the same time,
Get frequency data with the return value of hist like n, bins, pathces = ax.hist (x, ...).
What is the return patches?
The patches are a list, and the contents are objects for each bin of the drawn histogram. If you change the property of the object in the histogram bin, you can change the color of only that part.
import numpy as np
import matplotlib.pyplot as plt

mu, sigma = 100, 15
x = mu + sigma * np.random.randn(10000)

fig = plt.figure()
ax = fig.add_subplot(1,1,1)
edges = range(0,160,10)
n, bins, patches = ax.hist(x, bins=edges)
ax.set_title('tenth histogram $\mu=100,\ \sigma=15$')
ax.set_xlabel('x')
ax.set_ylabel('freq')
patches[9].set_facecolor('red')
patches[10].set_facecolor('green')
fig.show()
Recommended Posts