[PYTHON] I tried to verify the best way to find a good marriage partner
According to the current lifetime unmarried rate in Japan, one in four men and one in seven women have never been married until the age of 50, and the proportion of such people will continue to increase. (Source: Huffington Post). There seem to be various causes, but it seems that the reason ** "I can't meet the right person" ** comes to the top.
But what kind of person is the right person?
Depending on the person, such as annual income, appearance, personality, home, etc., there are various requirements for the other person, but even if you can meet a good person, such as "people meet once in a while", "maybe a better person in the future". You may often miss an opportunity while you're wondering if you can meet ... "(tears)
The problem is, if there is Mr. A looking for a marriage partner,
- Mr. A meets N people and women who are candidates for marriage.
- Candidate opponents appear one after another
- Candidate opponents have different scores
- Mr. A wants to marry a person with the highest score possible
- Candidates can get married if Mr. A says Yes. But I can't meet the rest of the candidates anymore
- Candidates will leave when Mr. A says No and can no longer meet
It can be simplified to a game with the rule. This problem is called the ** Secretary Problem **, and there is a mathematically optimal strategy. that is,
- The first 37% say No, whatever the score
- For people after that, if that person's score is the highest ever, decide on that person
It's really easy. Strictly speaking, 37% corresponds to ** 1 / e **. This strategy seems to increase the probability of marrying a high-scoring opponent regardless of the number of candidate opponents N.
Even when I hear that, I honestly think "Is it really?" I understand that I have to set a threshold somewhere, but I feel like I can find a better partner, such as 50% or 80% after waiting longer, instead of the odd value of 37%.
This time, I would like to use a simple simulation to test this strategy.
Strategy implementation
I will calculate using Python3. First, put in the required libraries.
# import libraries
import random
import numpy as np
import matplotlib.pyplot as plt
import seaborn as sns
The main function takes as input the number of candidates and the number of people who meet before creating the threshold, and selects the person who exceeds the threshold for the first time. The rank and score of the opponent are output. Suppose the candidate's score takes a random integer value from 0 to 100.
# function to find a partner based on a given decision-time
def getmeplease(rest, dt, fig):
    ## INPUT: rest ... integer representing the number of the fixed future encounters
    #         dt ... integer representing the decision time to set the threshold
    #         fig ... 1 if you want to plot the data
    # ++++++++++++++++++++++++++++++++++++++++++++++++++++++++++++++++

    # score ranging from 0 to 100
    scoremax = 100
    #random.seed(1220)

    # sequence of scores
    distribution = random.sample(range(scoremax), k=rest)

    # visualize distribution
    if fig==1:
        # visualize distribution of score
        plt.close('all')
        plt.bar(range(1,rest+1), distribution, width=1)
        plt.xlabel('sequence')
        plt.ylabel('score')
        plt.xlim((0.5,rest+0.5))
        plt.ylim((0,scoremax))
        plt.xticks(range(1, rest+1))

    # remember the highest score among the 100 x dt %
    if dt > 0:
        threshold = max(distribution[:dt])
    else:
        threshold = 0

    # pick up the first one whose score exceeds the threshold
    partner_id = 1
    partner_score = distribution[0]
    t = dt
    for t in range(dt+1, rest):
        if partner_score < threshold:
            partner_score = distribution[t]
        else:
            partner_id = t
            break
    else:
        partner_score = distribution[-1]
        partner_id = rest

    # get the actual ranking of the partner
    array = np.array(distribution)
    temp = array.argsort()
    ranks = np.empty(len(array), int)
    ranks[temp] = np.arange(len(array))
    partner_rank = rest - ranks[partner_id-1]

    # visualize all
    if fig==1:
        plt.plot([decisiontime+0.5,decisiontime+0.5],[0,scoremax],'--k')
        plt.bar(partner_id,partner_score, color='g', width=1)

    return [partner_id, partner_score, partner_rank]
For example, if the number of candidates is 10 and the number of people you meet before creating the threshold is 4 people, which is about 37% of that, this function getmeplease (10,4,1) draws the following graph.

…… I was able to marry the person with the highest score who appeared 8th out of 10 people ((((o ノ ´3 `) ノ awesome (white eyes))
simulation
Prepare 4 patterns of 5, 10, 20, 100 for the number of people N to meet. Similarly, I would like to prepare and compare four patterns of strategies when the number of people encountered before creating the threshold is changed to 10%, 37%, 50%, 80% of the total.
In the following function, each strategy ("optimal": 37%, "early": 10%, "late": 80%, "half": 50%) is simulated 10,000 times with the rank of the selected opponent. Make a histogram of the score and find the median.
# parameters
repeat = 10000
rest = [5,10,20,100]
opt_dt = [int(round(x/np.exp(1))) for x in rest]
tooearly_dt = [int(round(x*0.1)) for x in rest]
toolate_dt = [int(round(x*0.8)) for x in rest]
half_dt = [int(round(x*0.5)) for x in rest]

# initialization
opt_rank = np.zeros(repeat*len(rest))
early_rank = np.zeros(repeat*len(rest))
late_rank = np.zeros(repeat*len(rest))
half_rank = np.zeros(repeat*len(rest))
opt_score = np.zeros(repeat*len(rest))
early_score = np.zeros(repeat*len(rest))
late_score = np.zeros(repeat*len(rest))
half_score = np.zeros(repeat*len(rest))

# loop to find the actual rank and score of a partner
k = 0
for r in range(len(rest)):
    for i in range(repeat):
        # optimal model
        partner_opt = getmeplease(rest[r], opt_dt[r], 0)
        opt_score[k] = partner_opt[1]
        opt_rank[k] = partner_opt[2]

        # too-early model
        partner_early = getmeplease(rest[r], tooearly_dt[r], 0)
        early_score[k] = partner_early[1]
        early_rank[k] = partner_early[2]

        # too-late model
        partner_late = getmeplease(rest[r], toolate_dt[r], 0)
        late_score[k] = partner_late[1]
        late_rank[k] = partner_late[2]

        # half-time model
        partner_half = getmeplease(rest[r], half_dt[r], 0)
        half_score[k] = partner_half[1]
        half_rank[k] = partner_half[2]

        k += 1

# visualize distributions of ranks of chosen partners
plt.close('all')
begin = 0
for i in range(len(rest)):
    plt.figure(i+1)

    plt.subplot(2,2,1)
    plt.hist(opt_rank[begin:begin+repeat],color='blue')
    med = np.median(opt_rank[begin:begin+repeat])
    plt.plot([med, med],[0, repeat*0.8],'-r')
    plt.title('optimal: %i' %int(med))

    plt.subplot(2,2,2)
    plt.hist(early_rank[begin:begin+repeat],color='blue')
    med = np.median(early_rank[begin:begin+repeat])
    plt.plot([med, med],[0, repeat*0.8],'-r')
    plt.title('early: %i' %int(med))

    plt.subplot(2,2,3)
    plt.hist(late_rank[begin:begin+repeat],color='blue')
    med = np.median(late_rank[begin:begin+repeat])
    plt.plot([med, med],[0, repeat*0.8],'-r')
    plt.title('late: %i' %int(med))

    plt.subplot(2,2,4)
    plt.hist(half_rank[begin:begin+repeat],color='blue')
    med = np.median(half_rank[begin:begin+repeat])
    plt.plot([med, med],[0, repeat*0.8],'-r')
    plt.title('half: %i' %int(med))

    fig = plt.gcf()
    fig.canvas.set_window_title('rest' + ' ' + str(rest[i]))

    begin += repeat

    plt.savefig(figpath + 'rank_' + str(rest[i]))

begin = 0
for i in range(len(rest)):
    plt.figure(i+10)

    plt.subplot(2,2,1)
    plt.hist(opt_score[begin:begin+repeat],color='green')
    med = np.median(opt_score[begin:begin+repeat])
    plt.plot([med, med],[0, repeat*0.8],'-r')
    plt.title('optimal: %i' %int(med))

    plt.subplot(2,2,2)
    plt.hist(early_score[begin:begin+repeat],color='green')
    med = np.median(early_score[begin:begin+repeat])
    plt.plot([med, med],[0, repeat*0.8],'-r')
    plt.title('early: %i' %int(med))

    plt.subplot(2,2,3)
    plt.hist(late_score[begin:begin+repeat],color='green')
    med = np.median(late_score[begin:begin+repeat])
    plt.plot([med, med],[0, repeat*0.8],'-r')
    plt.title('late: %i' %int(med))

    plt.subplot(2,2,4)
    plt.hist(half_score[begin:begin+repeat],color='green')
    med = np.median(half_score[begin:begin+repeat])
    plt.plot([med, med],[0, repeat*0.8],'-r')
    plt.title('half: %i' %int(med))

    fig = plt.gcf()
    fig.canvas.set_window_title('rest' + ' ' + str(rest[i]))

    begin += repeat

    plt.savefig(figpath + 'score_' + str(rest[i]))
When N = 20
When meeting 20 people, the distribution of scores and ranks is as follows.
Rank
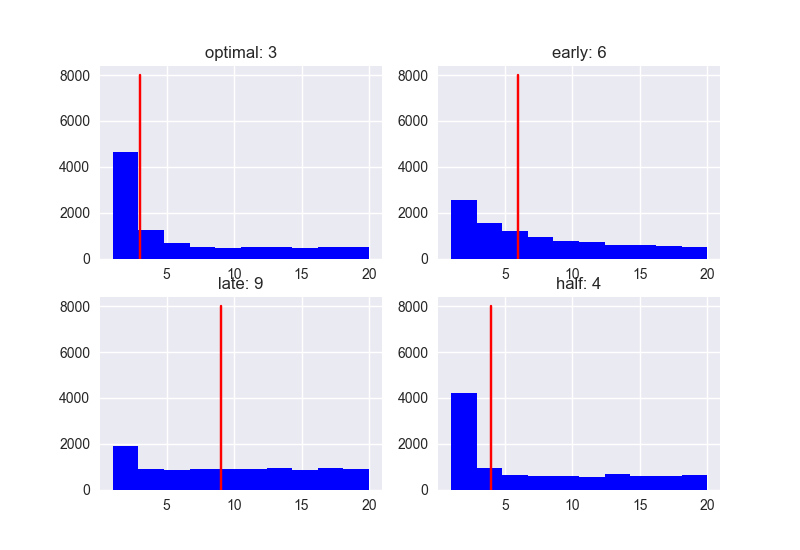
With the Optimal strategy (37%), the median rank was 3. If you approach with the strategy of "No for the first 37%, then Yes for the person with the highest score", you will be able to marry the person within the third of the people you can meet with high probability. ..
By the way, the median values for Early (10%) and Half (50%) are 6 and 4, respectively, so it's not bad (?). With Late (80%), the median is 9, so well, the probability of failure is high. .. ..
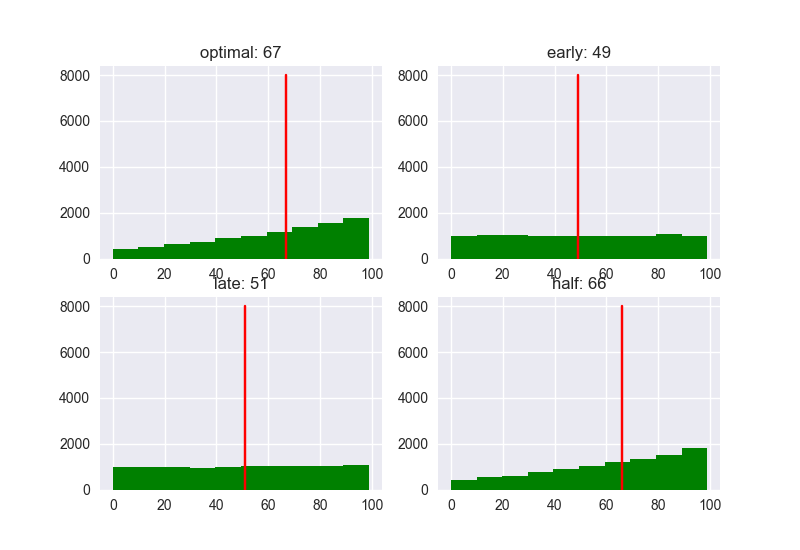
How about the score?

With the Optimal strategy (37%), the median score was 89. Other strategies have 78 for Early (10%), 59 for Late (80%), and 86 for Half (80%), so again, performance is high when the threshold is set to ** 1 / e **. is not it. It seems that it will be easier to decide on a better person. The best strategy does not always lead to the best solution, but it can increase the likelihood of approaching the best solution.
As a bonus, I will also list the number of candidates for 5, 10, and 100.
N = 5 ###
Rank

Score
N = 10 ###
Rank

Score

N = 100 ###
Rank
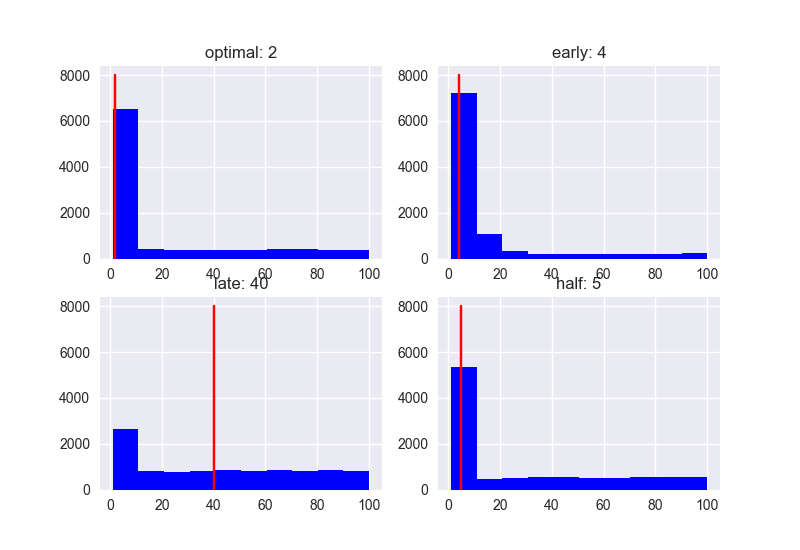
Score

The obvious trend is that as the number of candidates increases, the performance of "late" in particular deteriorates. If the number of candidates is small, the difference in performance depending on the strategy is small, but the score value tends to be low. In any case, it seems likely that the strategy of first meeting 37% of the people to set the threshold will be the one with the highest rank and higher score.
Conclusion
――The more candidates you have, the more likely you are to meet better opponents. ――However, if you mess up with "think more ...", not only will you lose opportunities, but the score of the final person will also worsen. ――That doesn't mean it's too early ――The best strategy is to decide the number of people you will meet in the future, meet the 1 / e people to set the threshold, and then decide the person who exceeds the threshold for the first time.
Caution
――In reality, even if you say Yes, the other party often says No. ―― ~~ People who write code at home on holidays ~~ often have no candidates in the first place -** Adopting the optimal strategy does not mean that the optimal solution can be obtained **
……Let's do our best!
Reference
Huffington Post Article TED Lecture * Hannah Fry-Mathematics to Talk about Love- [The Washington Post Article](https://www.washingtonpost.com/news/wonk/wp/2016/02/16/when-to-stop-dating-and-settle-down-according-to-math/ ? utm_term = .ee305554c210)