Find the cumulative distribution function by sorting (Python version)
This article is a rewrite of Calculate Cumulative Distribution Function by Sorting written in Ruby in Python.
Introduction
When you want to know the probability density function (PDF) of a random variable, you use a histogram for naive, but it takes trial and error to cut bins, and it takes a considerable number of measurements to get a clean graph. It is troublesome to become. In such a case, it is cleaner to look at the cumulative distribution function (CDF) instead of the probability density function, and it is easier to find it with a single sort. Below, we will introduce the differences between random numbers that follow a normal distribution when viewed in PDF and when viewed in CDF. The operation was confirmed by Google Colab.
Get the probability density function in the histogram
First, let's see how to obtain the probability density function from the histogram. Import all the libraries you will need later.
import random
import matplotlib.pyplot as plt
import numpy as np
from math import pi, exp, sqrt
from scipy.optimize import curve_fit
from scipy.special import erf
Generate 1000 random numbers that follow a Gaussian distribution with mean 1 and variance 1.
N = 1000
d = []
for _ in range(N):
  d.append(random.gauss(1, 1))
When I plot it, it looks like this.
plt.plot(d)
plt.show()
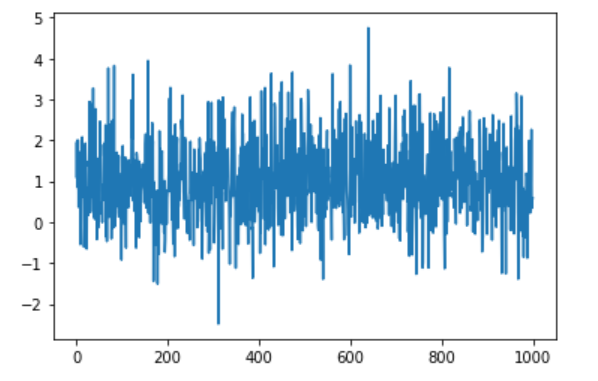
It looks like it's swaying around 1.
Let's make a histogram and find the probability density function. You can also find it with matplotlib.pyplot.hist, but I use numpy.histogram as a hobby of how to receive values.
hy, bins = np.histogram(d)
hx = bins[:-1] + np.diff(bins)/2
hy = hy / N
plt.plot(hx,hy)
plt.show()
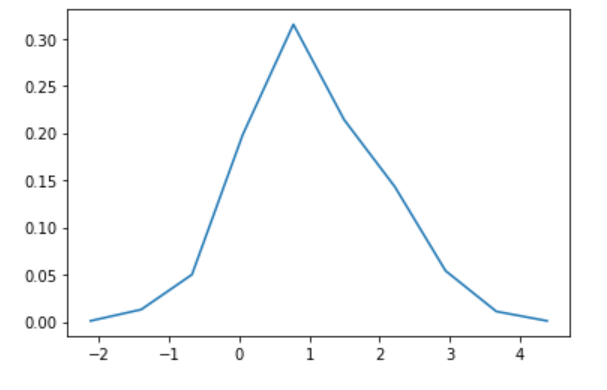
It looks like a Gaussian distribution, but it's pretty crazy.
Now, let's assume that this histogram has a Gaussian distribution and find the mean and standard deviation. Use scipy.optimize.curve_fit.
First, define the function used for fitting.
def mygauss(x, m, s):
  return 1.0/sqrt(2.0*pi*s**2) * np.exp(-(x-m)**2/(2.0*s**2))
Note that you must use np.exp instead of ʻexp as the NumPy array is passed to x. If you pass this function and data to scipy.optimize.curve_fit`, it will return an array of estimates and a covariance matrix, so let's display it.
v, s =  curve_fit(mygauss, hx, hy)
print(f"mu = {v[0]} +- {sqrt(s[0][0])}")
print(f"sigma = {v[1]} +- {sqrt(s[1][1])}")
Since the diagonal component of the covariance matrix is variance, its square root is displayed as an error. The result is different every time, but it looks like this, for example.
mu = 0.9778044193329654 +- 0.16595607115412642
sigma = 1.259695311989267 +- 0.13571713273726863
While the true values are both 1, the average estimate is 0.98 + -0.17 and the standard deviation is 1.3 + -0.1, which is not a big difference, but it's not good.
Get the cumulative distribution function by sorting
The cumulative distribution function $ F (x) $ is the probability that the value of a random variable $ X $ is smaller than $ x $, that is,
Is. Now, suppose that when $ N $ of independent data is obtained, the $ k $ th value is $ x $ by arranging them in ascending order. Then, the probability that the random variable $ X $ is smaller than $ x $ can be estimated as $ k / N $. From the above, the cumulative distribution function can be obtained by sorting the obtained array of $ N $ random variables and plotting the $ k $ th data on the x-axis and $ k / N $ on the y-axis. let's see.
sx = sorted(d)
sy = [i/N for i in range(N)]
plt.plot(sx, sy)
plt.show()
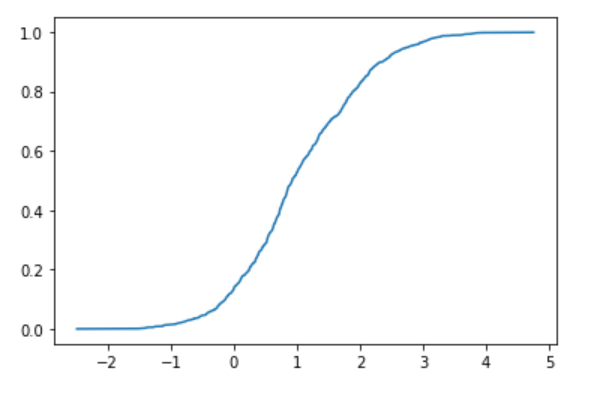
A relatively beautiful error function was obtained. As before, think of this as an error function and find the mean and variance by fitting. First, prepare the error function for fitting. Note that the definition of the error function in the world is delicate, so you have to add 1 and divide by 2, or divide the argument by √2.
def myerf(x, m, s):
  return (erf((x-m)/(sqrt(2.0)*s))+1.0)*0.5
Let's fit it.
v, s =  curve_fit(myerf, sx, sy)
print(f"mu = {v[0]} +- {sqrt(s[0][0])}")
print(f"sigma = {v[1]} +- {sqrt(s[1][1])}")
The result looks like this.
mu = 1.00378752698032 +- 0.0018097681998120645
sigma = 0.975197323266848 +- 0.0031393908850607445
The average is 1.004 + -0.002 and the standard deviation is 0.974 + -0.003, which is a considerable improvement despite using exactly the same data.
Summary
To see the distribution of random variables, I introduced how to get the probability density function using a histogram and how to sort and see the cumulative distribution function. Histograms require a lot of trial and error on how to cut bins, but it's easier to see the cumulative distribution function in a sort because it doesn't require any parameters. Even if you want a probability density function, you can get better data by finding the cumulative distribution function once, then moving average and numerically differentiating it.
Also, the cumulative distribution function is more accurate in estimating the parameters of the original distribution. This is intuitively in the area of interest (for example, near the mean), when using the histogram you can only use the number of data that fits in the bin, but in the case of the cumulative distribution function you can use about $ N / 2 $ of data. I think it can be used, but I'm not so confident, so ask a nearby professional.
Recommended Posts