2016 Todai Mathematik mit Python gelöst
Einführung
Dieser Artikel ist der Artikel zum 11. Tag von Python Advent Calendar 2016.
Was ist hier zu tun?
Der Python Adevent-Kalender des letzten Jahres befasste sich mit Mathematik IIB der Center-Prüfung, aber dieses Jahr werden wir uns mit Todai-Mathematik (Literatur) befassen.
- Die in diesem Artikel behandelten Fragen sind [Kawai Juku (allgemeine Bildungseinrichtung / Vorbereitungsschule) / 2016 National Public University Secondary Examination / Private University Aufnahmeprüfung Answer Bulletin](http://kaisoku.kawai-juku.ac.jp/nyushi/ Es wird aus honshi / 16 / t01.html zitiert.
Umgebung
- Python 3.5.0
- Anaconda 3-2.4.0
Grundlegende Verwendung von Sympy
Was ist Sympy?
Python-Symbolberechnungsbibliothek Offizielles Dokument: http://www.sympy.org/en/index.html Japanische Materialien: http://www.turbare.net/transl/scipy-lecture-notes/packages/sympy.html
Symbol-Variablen-Definition
In [1]: from sympy import *
In [2]: x + 1
---------------------------------------------------------------------------
NameError                                 Traceback (most recent call last)
<ipython-input-2-4cf92658b648> in <module>()
----> 1 x + 1

NameError: name 'x' is not defined

In [3]: x = symbols('x')
In [4]: x + 1
Out[4]: x + 1
erweitern - erweitern
In [5]: expand((x + 1)**2)
Out[5]: x**2 + 2*x + 1
Faktor - Faktorisierung
In [6]: factor(x**4 - 3*x**2 + 1)
Out[6]: (1 + x - x**2)*(1 - x - x**2)
vereinfachen - Vereinfachen
In [7]: simplify((x**3 + x**2 - x - 1)/(x**2 + 2*x + 1))
Out[7]: x - 1
limit --extreme
In [8]: limit(x, x, oo)
Out[8]: oo
Diff-Differenzierung
In [9]: diff(cos(x), x)
Out[9]: -sin(x)
In [10]: diff(x**3 + x**2 - x - 1, x)
Out[10]: 3*x**2 + 2*x - 1
integrieren - integrieren
In [11]: integrate(cos(x), x)
Out[11]: sin(x)
In [12]: integrate(x**3 + x**2 - x - 1, x)
Out[12]: x**4/4 + x**3/3 - x**2/2 - x
Matrix-Matrix
In [13]: Matrix([[1, 2, 3], [-2, 0, 4]])
Out[13]:
Matrix([
[ 1, 2, 3],
[-2, 0, 4]])
lösen - einen Ausdruck lösen
In [14]: solve(x**2 - 1, x)
Out[14]: [-1, 1]
Frage 1

- Die Variable xy wird mithilfe von Symbolen definiert
- Lassen Sie jede Koordinate PQR mit Matrix in einen Vektor fallen
In [1]: import sympy as sy
In [2]: x, y = sy.symbols('x y')
In [3]: P = sy.Matrix([x, y])
In [4]: Q = sy.Matrix([-x, -y])
In [5]: R = sy.Matrix([1, 0])
- △ Drücken Sie die Bedingung aus, dass PQR ein scharfes Dreieck ist, indem Sie das innere Produkt der Vektoren verwenden
- ∠ Wenn QPR 90 ° oder weniger beträgt, ist $ \ vec {PQ} $ ・ $ \ vec {PR} $> 0
- ∠ Wenn der PQR 90 ° oder weniger beträgt, ist $ \ vec {QP} $ ・ $ \ vec {QR} $> 0
- ∠ Wenn PRQ 90 ° oder weniger beträgt, ist $ \ vec {RP} $ ・ $ \ vec {RQ} $> 0
- Für diejenigen, die mehr über das innere Produkt und den Blickwinkel erfahren möchten, ["Wenn Sie das innere Produkt sehen können, können Sie Statistiken sehen" (5. Mathematikstudiengruppe für Programmierer, Präsentationsmaterial) (http://www.slideshare.net/matsukenbook/ 5-55326268) wird empfohlen
- $ \ Vec {PQ} $ ・ $ \ vec {PR} $ = PQ.norm () x PR.norm () x cos ∠QPR
normist die Länge des Vektors
In [6]: sy.simplify((Q - P).dot(R - P) > 0)
Out[6]: 2*x*(x - 1) + 2*y**2 > 0
In [7]: sy.simplify((P - Q).dot(R - Q) > 0)
Out[7]: 2*x*(x + 1) + 2*y**2 > 0
In [8]: sy.simplify((P - R).dot(Q - R) > 0)
Out[8]: -x**2 - y**2 + 1 > 0
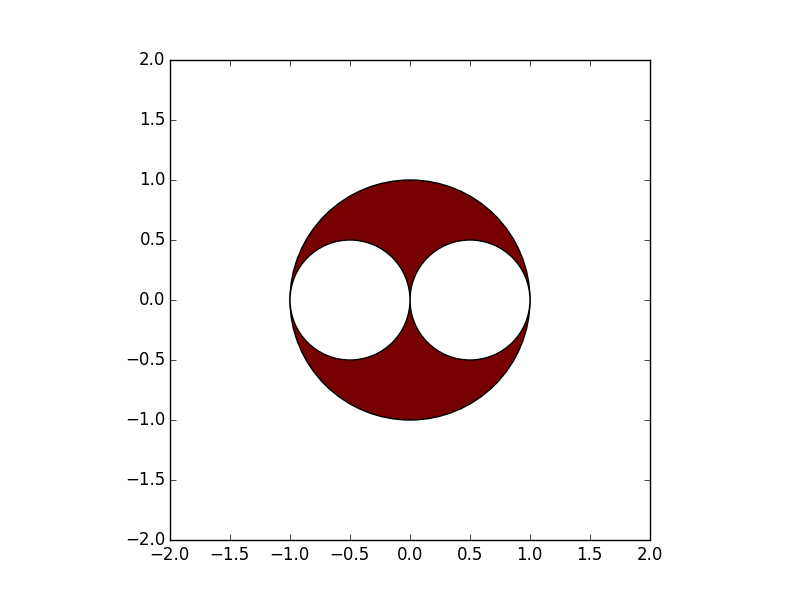
- Refaktorieren Sie die drei daraus erhaltenen Gleichungen, um es einfacher zu machen, als Bedingung des Kreises zu sehen
2x(x-1)+2y^2 > 0 <=> (x-\frac{1}{2})^2+y^2 > \frac{1}{4}
2x(x+1)+2y^2 > 0 <=> (x+\frac{1}{2})^2+y^2 > \frac{1}{4}
-x^2 - y^2 + 1 > 0 <=> x^2+y^2 < 1
- Zeichnen Sie ein Diagramm, das diese Bedingung erfüllt
In [9]: import matplotlib.pyplot as plt
In [10]: fig = plt.figure()
In [11]: ax = plt.gca()
In [12]: ax.add_patch(plt.Circle((0,0),1,fc="#770000"))
Out[12]: <matplotlib.patches.Circle at 0x109689518>
In [13]: ax.add_patch(plt.Circle((0.5,0),0.5, fc="#FFFFFF"))
Out[13]: <matplotlib.patches.Circle at 0x109689f28>
In [14]: ax.add_patch(plt.Circle((-0.5,0),0.5, fc="#FFFFFF"))
Out[14]: <matplotlib.patches.Circle at 0x109696710>
- Richten Sie die Seitenverhältnisse der X- und Y-Achse aus
- Stellen Sie die oberen und unteren Grenzen der Achse ein
In [15]: ax.set_aspect('equal')
In [16]: plt.xlim([2, 2])
Out[16]: (-2, 2)
In [17]: plt.ylim([-2, 2])
Out[17]: (-2, 2)
- Zeichnen Sie das Antwortdiagramm
In [18]: plt.show()

** Antwort: Der Punktebereich P (x, y) ist der rote Teil des Diagramms **
Nachschlagewerk
Einführung in die Mathematik beginnend mit Python
Das diesmal eingeführte Sympy und Matplotlib werden ebenfalls vorgestellt. Empfohlen für den Einstieg in die mathematische Programmierung.
schließlich
Wenn Sie Sympy so verwenden, können Sie es leicht auf der Ebene der Aufnahmeprüfung für die Universität lösen. Es besteht die Sorge, dass die Mathematik der Universität Tokio auf einem so einfachen Niveau sein sollte, aber ...
Hier wurde nur die erste Frage behandelt, aber wenn Sie interessiert sind, versuchen Sie bitte, andere mathematische Probleme mit Python zu lösen!
Recommended Posts