[PYTHON] Is there a secret to the frequency of pi numbers?
【Overview】
I checked the frequency of numbers that appear in pi. I also checked the number of Napiers. The target is after the decimal point.
[Preparation]
-Obtain the API key from Plotly to use the Python library Plotly. (Not required if you do not draw a graph) ・ Pi and Number of Napiers Copy and paste the numbers after the decimal point into the text from /e.5mil). (Note that the number of Napiers is filled with 0 because the first line has a different digit from the other lines.)
[Folder structure]
|---scripts | --- pi.py (Check the frequency of pi numbers) | --- pi_graph.py (Create a bar graph of pi) | --- pi.txt (Pi after the decimal point) | --- e.py (Check the frequency of Napier numbers) | --- e_graph.py (Create bar graph of Napier number) | --- e.txt (number of napiers after the decimal point)
[Program and results]
To display the graph https://plot.ly/~ユーザ名/0/#plot You can see it by accessing.
pi.py
# -*- coding: utf-8 -*-
zero = 0
one = 0
two = 0
three = 0
four = 0
five = 0
six = 0
seven = 0
eight = 0
nine = 0
for line in open('pi.txt', 'r'):
for i in xrange(100):
if(line[i] == '0'):
zero += 1
elif(line[i] == '1'):
one += 1
elif(line[i] == '2'):
two += 1
elif(line[i] == '3'):
three += 1
elif(line[i] == '4'):
four += 1
elif(line[i] == '5'):
five += 1
elif(line[i] == '6'):
six += 1
elif(line[i] == '7'):
seven += 1
elif(line[i] == '8'):
eight += 1
elif(line[i] == '9'):
nine += 1
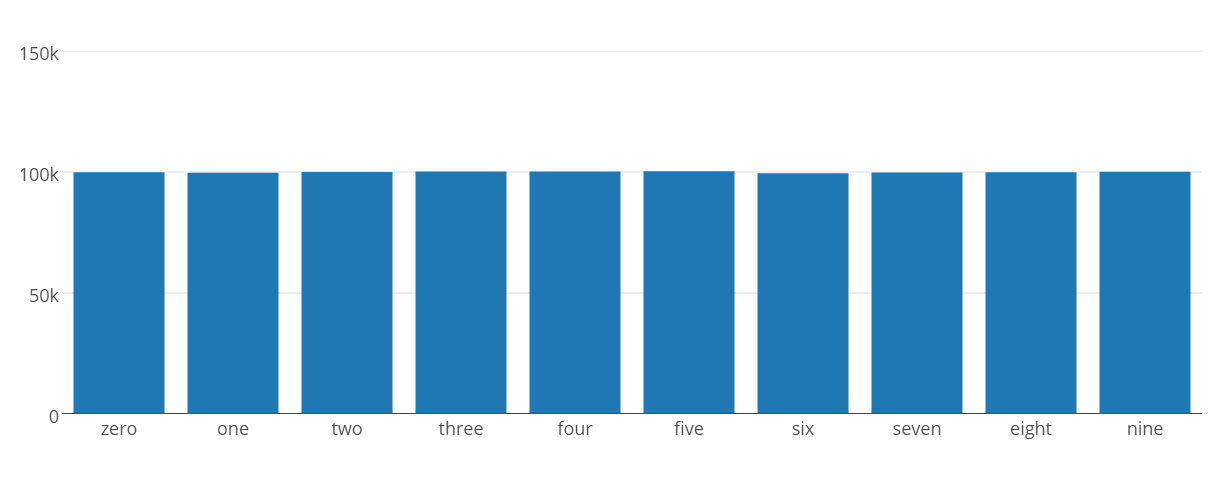
print zero #99959
print one #99758
print two #100026
print three #100229
print four #100230
print five #100359
print six #99548
print seven #99800
print eight #99985
print nine #100106
e.py
# -*- coding: utf-8 -*-
zero = -3 #I've filled the first line of text with three zeros, so I'll reduce it.
one = 0
two = 0
three = 0
four = 0
five = 0
six = 0
seven = 0
eight = 0
nine = 0
for line in open('e.txt', 'r'):
for i in xrange(60):
if(line[i] == '0'):
zero += 1
elif(line[i] == '1'):
one += 1
elif(line[i] == '2'):
two += 1
elif(line[i] == '3'):
three += 1
elif(line[i] == '4'):
four += 1
elif(line[i] == '5'):
five += 1
elif(line[i] == '6'):
six += 1
elif(line[i] == '7'):
seven += 1
elif(line[i] == '8'):
eight += 1
elif(line[i] == '9'):
nine += 1
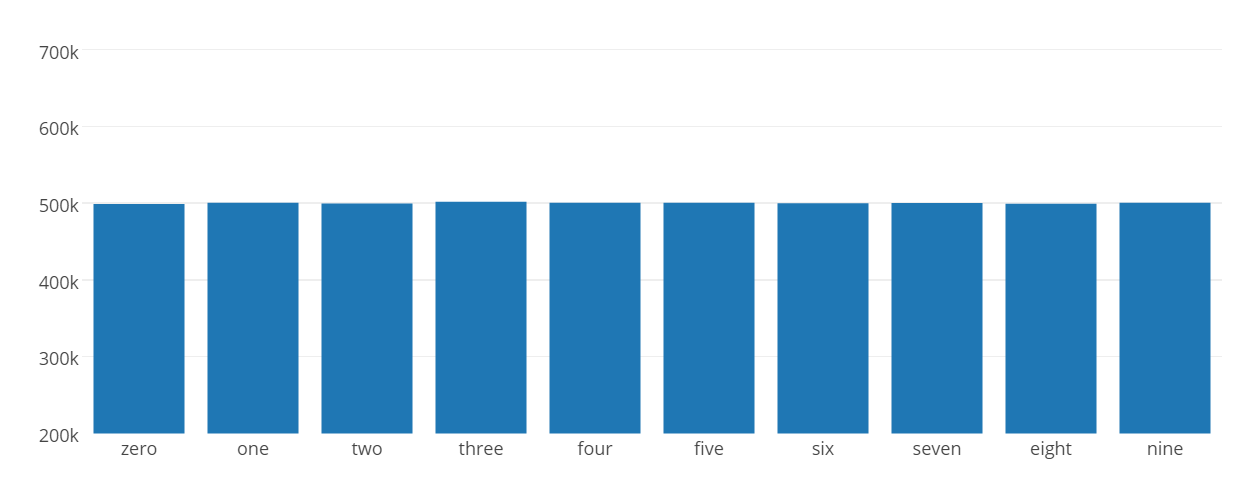
print zero #498642
print one #500511
print two #499302
print three #501715
print four #500420
print five #500489
print six #499875
print seven #500015
print eight #499078
print nine #500290
pi_graph.py
# -*- coding: utf-8 -*-

import plotly
import plotly.plotly as py
import plotly.graph_objs as go
plotly.tools.set_credentials_file(username='User name', api_key='API key')

data = [go.Bar(
            x=['zero', 'one', 'two', 'three', 'four', 'five', 'six', 'seven', 'eight', 'nine'],
            y=[99959, 99758, 100026, 100229, 100230, 100359, 99548, 99800, 99985, 100106]
    )]

py.iplot(data, filename='basic-bar')
e_graph.py
# -*- coding: utf-8 -*-

import plotly
import plotly.plotly as py
import plotly.graph_objs as go
plotly.tools.set_credentials_file(username='User name', api_key='API key')

data = [go.Bar(
            x=['zero', 'one', 'two', 'three', 'four', 'five', 'six', 'seven', 'eight', 'nine'],
            y=[498642, 500511, 499302, 501715, 500420, 500489, 499875, 500015, 499078, 500290]
    )]

py.iplot(data, filename='basic-bar')
[Discussion]
It seems that both the pi and the number of Napiers appear at the same frequency ... Is there a mathematical theorem that already appears at the same frequency? (If you know it, please let me know in the comments)
[Reference site]
https://plot.ly/python/bar-charts/
Recommended Posts