Get stock prices and create candlestick charts in Python
I will write about stock price acquisition and stock price chart (candlestick chart) for stock price analysis. My dreams are only expanding, such as deep learning of time-series data, but this time I will collect tools for studying. However, this is a memo I am studying, so please forgive me for making mistakes (especially in economic terms).
Candlestick chart
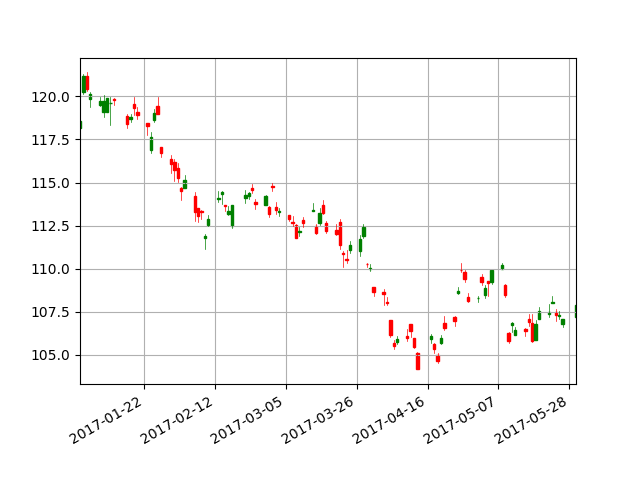
According to Wikipedia, a candlestick chart is a "unit period, with the first price attached during the unit period as the opening price, the last price attached as the closing price, the highest price as the highest price, and the lowest price as the lowest price. These four types of prices (four values) are drawn on a single bar-shaped figure called a candle, arranged in chronological order, and the fluctuation of the stock price is represented as a graph. "(Reference: Wikipedia" Candlestick " Chart ").
The red candle is the day when the stock price finally rises, and the green candle is the day when the stock price finally falls, making it easy to visually understand the up and down movement of the stock price. Now, I will explain how to create this candlestick chart.
environment
・ Windows 8 ・ Anaconda 4.4.0 (Python3.6) ・ Install "daytime" and "pandas_datareader" with pip
Data acquisition
Python3.6:GetStock.py
import datetime
import pandas_datareader.data as web

#Setting the period
start = datetime.datetime(2017, 1, 1)
end = datetime.datetime(2017, 5, 30)

#Stock price acquisition
df = web.DataReader('TM', 'google', start, end)
df = toyota.drop('Volume', axis=1)  #Erase Volume from DataFrame
df = df.loc[:, ['Open', 'Close', 'High','Low']]
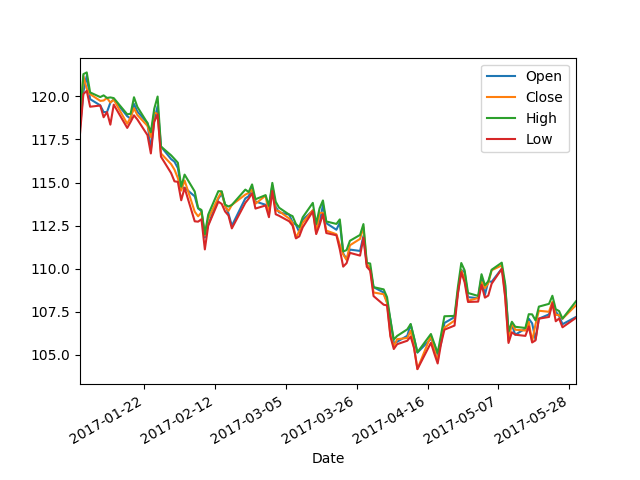
Python has a library to get stock prices, and if you enter the start date, end date, company, and the site to get the data as arguments, it will return it in a format that can be used with pandas. In the case of Google, Volume is also included in the data, but since it is unnecessary, delete it (By the way, Volume is the number of shares traded). Finally, sort the data. The results are shown in the figure below, but as you can see, the relationship between the four values is not clear. So, finally, I will explain how to write a candlestick chart.
Candlestick chart creation
There is also a candlestick charting library. The upper half is the one explained earlier in data acquisition. A function called "mpf.candlestick_ochl" is provided, so you can easily create a diagram by entering the date and the corresponding data as arguments. A grid is attached to improve visibility.
python3.6:RousokuasiChart.py
import numpy as np
import datetime
import pandas_datareader.data as web
import matplotlib.pyplot as plt
import matplotlib.finance as mpf
from matplotlib.dates import date2num

def main():
    #Setting the stock price acquisition period
    start = datetime.datetime(2017, 1, 1)
    end = datetime.datetime(2017, 5, 30)

    #Stock price acquisition
    df = web.DataReader('TM', 'google', start, end)
    df = toyota.drop('Volume', axis=1)  #Erase Volume from DataFrame
    df = df.ix[:, ['Open', 'Close', 'High','Low']]

    #Image creation
    fig = plt.figure()
    ax = plt.subplot()
    xdate = [x.date() for x in df.index]  #date
    ochl = np.vstack((date2num(xdate), df.values.T)).T
    mpf.candlestick_ochl(ax, ochl, width=0.7, colorup='g', colordown='r')
    ax.grid()  #Grid display
    ax.set_xlim(df.index[0].date(), df.index[-1].date())  #x-axis range
    fig.autofmt_xdate()  #x-axis autoformat
    plt.savefig('rousokuasi_chart.png')#Save image

if __name__ == '__main__':
    main()
Running this program completes the candlestick chart you first saw.
Reference site
- "Forecast stock prices from past data by big data analysis"
http://qiita.com/ynakayama/items/420ebe206e34f9941e51
- Get the stock price with Python and display it as a graph
http://qiita.com/akichikn/items/782033e746c7ee6832f5
- Display candlestick chart in Python (matplotlib edition)
http://qiita.com/toyolab/items/1b5d11b5d376bd542022
Recommended Posts