[PYTHON] I made a Chrome extension that displays a graph on an AMeDAS page
Extension "Amedos"

What you can do
--Amedas hourly observation data page of the Japan Meteorological Agency (Example: [Tokyo]](https://www.jma.go.jp/jp/amedas_h/today-44132.html?areaCode=000&groupCode=30 )) ** Display the graph **. The displayed contents are the temperature of today and yesterday, and the precipitation of today or yesterday. --Display ** links to past observation data ** above the graph. Now you can easily jump to the past weather data search page for that location. By the way, the date of the previous day has already been selected!
How to make
Graph: Chart.js
Chart.js | Open source HTML5 Charts for your website
I used it to draw a graph.
Search past weather data: Create correspondence table
** The AMeDAS observatory number and the observatory code for past meteorological data retrieval are different **, so it was necessary to associate the two.
You can find the observatory number at that point from the URL of the observation data page every hour. The list can be downloaded as csv from Japan Meteorological Agency | About AMeDAS.
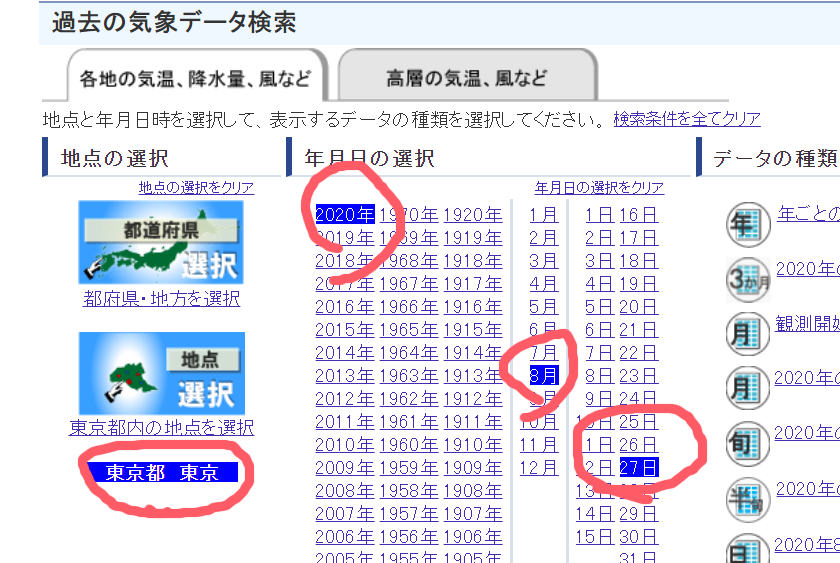
On the other hand, the observatory code of the past meteorological data search does not have a mechanism to be seen in the list as far as I searched, so I made a list by ** scraping ** by Python.
The observatory code is represented by a combination of prec_no and block_no.
Japan Meteorological Agency | Past Meteorological Data Search From the source, you can see the list of prec_no.

You can see block_no at each link.

I made a list by scraping these pages. I used Beautiful Soup for scraping and operated it on Jupyter Lab.
Beautiful Soup Documentation — Beautiful Soup 4.9.0 documentation
After that, the correspondence table is completed by inner joining the two tables. There are two keys, the prefectural promotion bureau and the name of the observatory. I output it in json format and import it.
Reason and impression of making
My hobby is to watch AMeDAS on a regular basis, and especially in the recent summer, the records are updated so I never get tired of watching it. While looking at the AMeDAS page many times and comparing it with yesterday's temperature and seeing how the temperature drops when it rains, I decided to make it because I thought it would be more interesting if there was a graph. did. There are also sites such as Japan Weather Association that graph using data from the Japan Meteorological Agency, but it is better to see them directly. I thought.
It was almost the first time to touch javascript, let alone create a browser extension, but it became a mechanism to make simple things very easily. When it was completed, I thought I would post it on Qiita for the first time, which also motivated me. The production time was 13 hours without application work and Qiita article creation time.
Reference site
I tried drawing a graph with Chart.js --Qiita Beautiful Soup in 10 minutes --Qiita Scraping with JavaScript --HANAUTA INC. Creating a minimal chrome extension that isn't exposed to the outside world can be done in less than an hour-Qiita
Recommended Posts