[PYTHON] Try using Jupyter Notebook dynamically
Current environment
- ASUS C300
- Chrome OS(linux-64)
- miniconda3-3.18.3
- python 3.5.1
- jupyter 4.0.6 -chromebrew + git installed
RISE
--From before using live_reveal Dynamic HTML could be generated, but recently a project called RISE looks good. --I couldn't build the environment for some reason when ipython 3.x + live_reveal, but this time I entered quickly.
git clone https://github.com/damianavila/RISE
cd RISE
python setup.py install
--This will add a slideshow button to localhost jupyter --You can make a presentation with dynamic HTML, and even the code inside can be rewritten. ――I wrote up to that point and noticed that there was already a wonderful Qiita article.
pivottablejs [Reference URL](http://esu-ko.hatenablog.com/entry/2016/03/04/Python%E3%81%A7%E6%8E%A2%E7%B4%A2%E7%9A%84 % E3% 83% 87% E3% 83% BC% E3% 82% BF% E5% 88% 86% E6% 9E% 90% E3% 81% 97% E3% 81% 9F% E3% 81% 84% E3 % 81% AE% E3% 81% A7pivottablejs% E3% 82% 92% E4% BD% BF% E3% 81% 86)
conda install pivottablejs
--You can extend the graph drawing of pandas to dynamically switch from the table to the scatter plot and change the axis of the scatter plot.

ipywidgets.interact --There is also a wonderful Qiita article. --In Jupyter 4.x, IPython.html.widgets has been deprecated and is now ipywidgets. --Installation
conda install ipywidgets
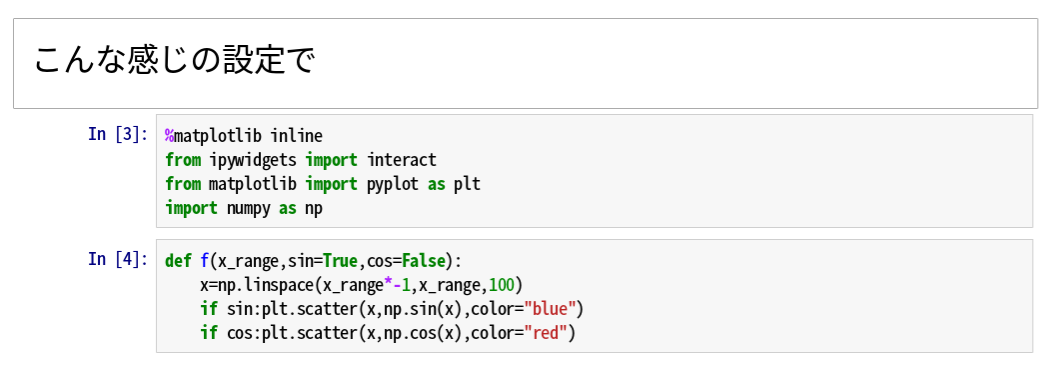
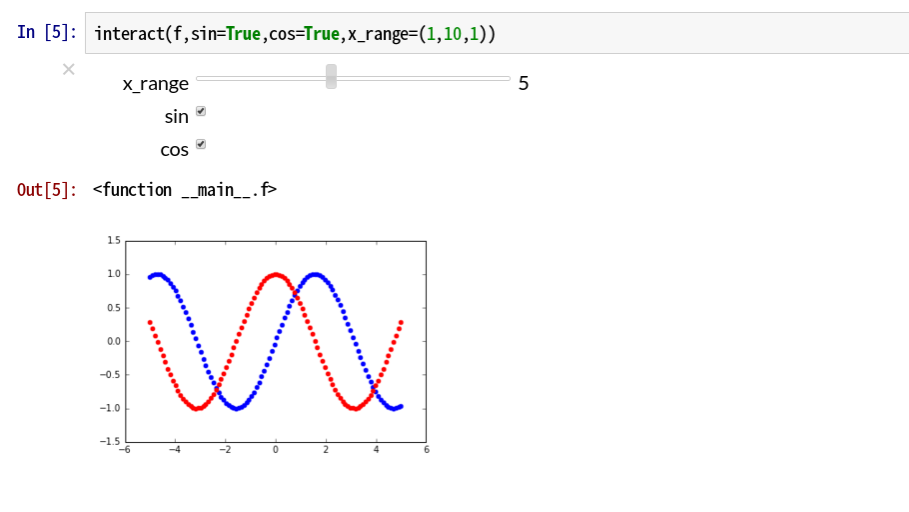
Passing a function and parameters to interact will generate a widget that will change the parameters.
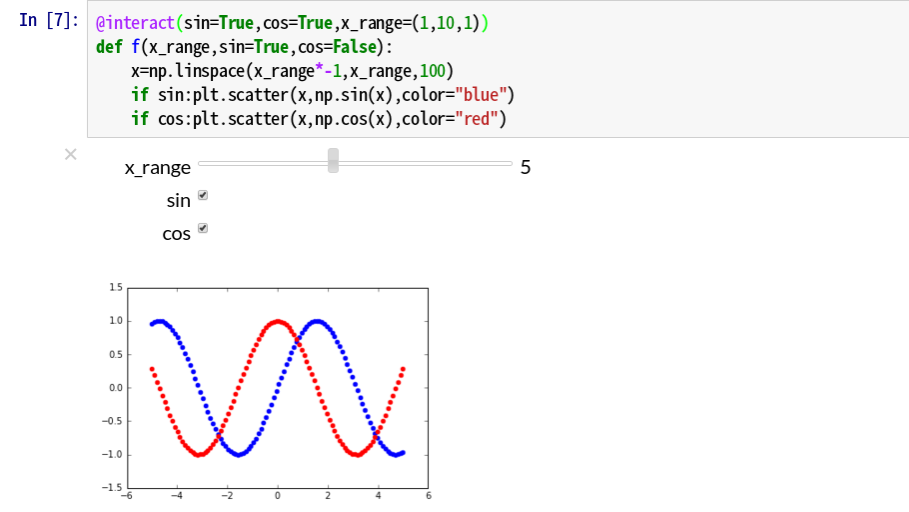
You can also use interact as a function decorator, This method is also quite smart.
bokeh --Although the version is updated frequently and the API is not stable, you can scale the visualization called bokeh. There is a library. -Reference --If you let interect specify the parameters and draw with bokeh, you will feel like you are using spotfire or tableau.
conda install bokeh
Example of use
from sklearn.datasets import load_breast_cancer
import pandas as pd
cancer=load_breast_cancer()
data=pd.DataFrame(cancer.data,columns=cancer.feature_names)
data["target"]=[cancer.target_names[i] for i in cancer.target]
def interactivebokeh(x_axis,y_axis):
    fig=bplt.figure(plot_width=640, plot_height=320)
    fig.circle(
                data[data.target=="malignant"][x_axis],
                data[data.target=="malignant"][y_axis],
                line_color="red",fill_color="red"
                )
    fig.square(
                data[data.target=="benign"][x_axis],
                data[data.target=="benign"][y_axis],
                line_color="blue",fill_color="blue"
                )
    bplt.show(fig)

Recommended Posts