[PYTHON] How to interactively draw a machine learning pipeline with scikit-learn and save it in HTML
In this article, I will explain the implementation of interactive pipeline confirmation installed from v0.23 of scikit-learn, and how to save and utilize it as HTML.
environment
- scikit-learn==0.23.2
- Google Colaboratory
The implementation code for this article is here https://github.com/YutaroOgawa/Qiita/tree/master/sklearn
Implementation
[1] Version update
First, the version of scikit-learn of Google Colaboratory is v0.22 in September 2020, so update it to v0.23.
!pip install scikit-learn==0.23.2
After updating with pip, execute "Runtime"-> "Restart Runtime" of Google Colaboratory, Restart the runtime. (This is the new v0.23 that scikit-learn put in with pip)
[2] Pipeline construction
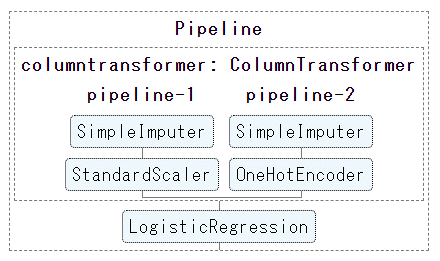
For example, we combined preprocessing and machine learning models as follows: Build a ** machine learning pipeline **.
[Perform necessary import]
python
from sklearn.pipeline import make_pipeline
from sklearn.preprocessing import OneHotEncoder, StandardScaler
from sklearn.impute import SimpleImputer
from sklearn.compose import make_column_transformer
from sklearn.linear_model import LogisticRegression
[Build a pipeline]

```python```
#Preprocessing of numerical data (median missing value complemented and standardized)
num_proc = make_pipeline(SimpleImputer(strategy='median'), StandardScaler())

#Preprocessing of category data (for missing values"misssing"Substitution completion, one-hot encoding)
cat_proc = make_pipeline(
    SimpleImputer(strategy='constant', fill_value='missing'),
    OneHotEncoder(handle_unknown='ignore'))

#Create preprocessing class
preprocessor = make_column_transformer((num_proc, ('feat1', 'feat3')),
                                       (cat_proc, ('feat0', 'feat2')))

#Combine preprocessing and machine learning models into one pipeline
clf = make_pipeline(preprocessor, LogisticRegression())
[3] Interactively visualize the pipeline
To interactively visualize the pipeline, it ’s simple,
sklearn.set_config(display="diagram")
Just add.
[Interactive visualization]
python
Settings to display the pipeline
from sklearn import set_config
set_config(display="diagram")
drawing
clf
Then, the pipeline will be drawn in the result column of JupyterNotebook (Google Colabortory) as shown below.

Click each element in the diagram of this pipeline to
The image changes interactively, displaying the advanced settings for that element.
(The figure below shows the detailed confirmation of the missing value processing method for column preprocessing: pipeline.-Click 2 Simple Impactor)

##How to save the pipeline as HTML
As you mentioned in the comments, you can save this interactive pipeline as HTML.
"It's a little if it only works on Jupyter Notebook ..."
I thought, so it's very nice information.
@Thank you to DataSkywalker.
Finally, as an implementation,
```python
from sklearn.utils import estimator_html_repr
with open('my_estimator.html', 'w') as f:
f.write(estimator_html_repr(clf))
To execute. Then my_estimator.The HTML for the interactive pipeline is saved as html.
With Google Colaboratory
# Download from Google Colaboratory
from google.colab import files
files.download('my_estimator.html')
By running my_estimator.You can download html (The HTML file included CSS style and was about 300 lines).
As a material to explain the pipeline interactively It seems that you can paste HTML into documents etc.
You can put it in the md file as a link, or you can forcibly convert the md file to html and then combine it. (It is difficult to read html as it is into an md file ...?)

All the files around here are also placed here https://github.com/YutaroOgawa/Qiita/tree/master/sklearn
##Summary
scikit-Learn version v0.23 or above
sklearn.set_config(display="diagram")Just add
You can interactively visualize (and save as HTML) your pipeline.
Please try it ♪
###Remarks
**【Writer】**Dentsu International Information Services (ISID)AI Transformation CenterDevelopment Gr Yutaro Ogawa (main book)"Learn while making!Development Deep Learning by PyTorch ",Other"Detailsofself-introduction")
【Twitter】 Focusing on IT / AI-related and business / management, I send out articles that I find interesting and impressions of new books that I recently read. If you want to collect information on these fields, please follow us ♪ (There is a lot of overseas information)
[Other] The "AI Transformation Center Development Team" that I lead is looking for members. If you are interested,This pageWe are looking forward to your application.
[Sokumen-kun] If you want to apply suddenly, we will have a casual interview with "Sokumen-kun". Please use this as well ♪ https://sokumenkun.com/2020/08/17/yutaro-ogawa/
[Disclaimer] The content of this article is the opinion of the author./It is a transmission, not an official view of the company to which the author belongs.
(reference) https://scikit-learn.org/stable/auto_examples/release_highlights/plot_release_highlights_0_23_0.html https://towardsdatascience.com/9-things-you-should-know-about-scikit-learn-0-23-9426d8e1772c
Recommended Posts