Add diagonal lines (hatch) to heatmap (python, matplotlib)
Introduction
I wanted to draw a diagonal line ('/') on the part showing a specific value on the heat map, so make a note.
Thing you want to do
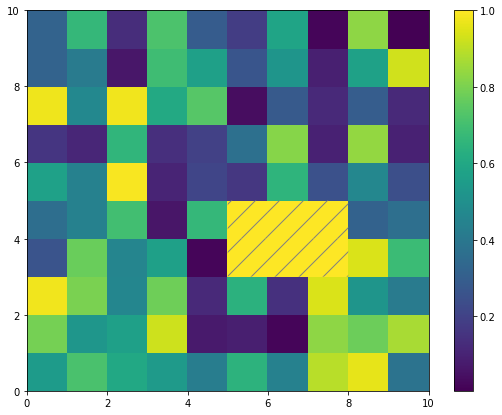
In the following heat map, I want to make the part of a specific value look good with diagonal lines.
%matplotlib inline
import matplotlib.pyplot as plt
import numpy as np

np.random.seed(0)
Z =np.random.rand(10, 10)
Zm = Z * 0
Z[3:5, 5:8] = 1
fig, ax = plt.subplots(figsize=(9, 7))
ax1 = ax.pcolormesh(Z)
fig.colorbar(ax1)

In the figure above, some values in the figure are set to 1 with Z [3: 5, 5: 8] = 1.
Draw a diagonal line in this Z [3: 5, 5: 8] part.
Solution
The final code is below.
np.random.seed(0)
Z =np.random.rand(10, 10)
Zm = Z * 0
Z[3:5, 5:8] = 1
fig, ax = plt.subplots(figsize=(9, 7))
ax1 = ax.pcolormesh(Z)
Zm = np.ma.masked_where(Z!=1, Z)
ax2 = ax.pcolor(Zm, hatch='/', edgecolor='grey',facecolor='none', linewidth=0.0)
fig.colorbar(ax1)
```
#what are you doing
In the above code, the following two lines are different from the first.
``````python
Zm = np.ma.masked_where(Z!=1, Z)
ax2 = ax.pcolor(Zm, hatch='/', edgecolor='grey',facecolor='none', linewidth=0.0)
```
## Line 1: Matrix mask
In order to show only a part with diagonal lines, the matrix (`Zm`) representing that part is created in the first line of the code.
By using `numpy.ma.masked_where`, you can create a matrix in which the part corresponding to the condition is invalidated (masked).
Reference: [numpy.ma.masked_where official documentation](https://docs.scipy.org/doc/numpy/reference/generated/numpy.ma.masked_where.html)
The original matrix (`Z`) and the masked matrix (`Zm`) are as follows.
<img width="616" alt="スクリーンショット 2019-12-03 13.53.23.png " src="https://qiita-image-store.s3.ap-northeast-1.amazonaws.com/0/167418/d964c787-cd0a-37c3-bbd3-bfeeb49b3b73.png ">
<img width="616" alt="スクリーンショット 2019-12-03 13.53.33.png " src="https://qiita-image-store.s3.ap-northeast-1.amazonaws.com/0/167418/67c775c9-f2fa-a1b2-c7fa-39baad0c821c.png ">
Looking at the contents of the matrix, in `Zm`, except for the elements corresponding to the conditional expression (`Z! = 1`), they are represented by `--`.
By using this matrix `Zm` when plotting, you can plot by ignoring the part corresponding to the conditional expression.
## 2nd line: Draw diagonal lines with hatch
Reference: [python – How can I fill the area with only hatch (no background color) in matplotlib 2.0? ](Https://codeday.me/jp/qa/20190618/1041536.html)
In the second line of code, the matrix `Zm` is used to draw the diagonal lines.
In `matplotlib.pyplot.pcolor`, the following pattern of hatch can be used.
> / - diagonal hatching
\ - back diagonal
| - vertical
- - horizontal
+ - crossed
x - crossed diagonal
o - small circle
O - large circle
. - dots
* - stars
Reference: [matplotlib.collections.Collection.set_hatch](https://matplotlib.org/3.1.1/api/collections_api.html#matplotlib.collections.Collection.set_hatch)
The options used here are as follows.
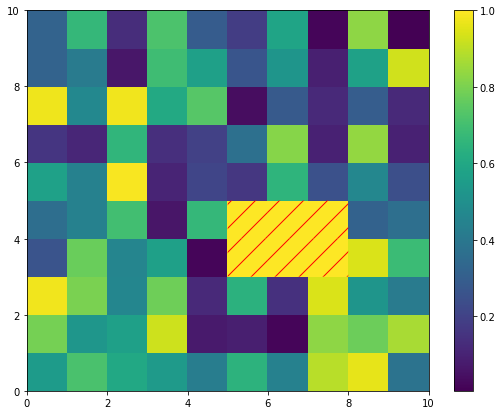
--ʻEdgecolor`: hatch color
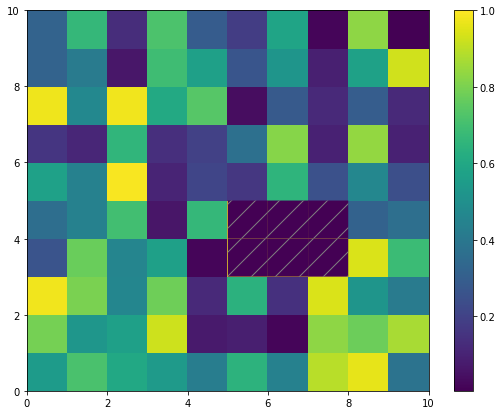
--`facecolor`: The background color of hatch. By setting it to'none', only hatch can be displayed while leaving the color of the heat map.
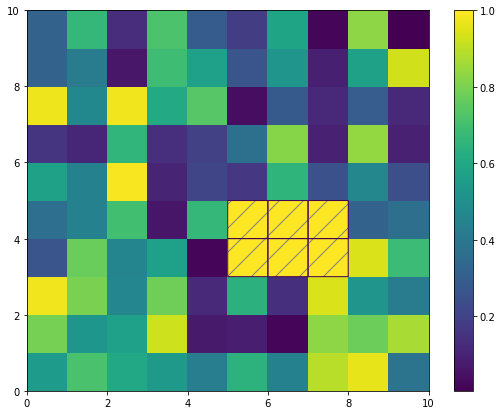
--`linewidth`: Grid thickness. If you specify a value greater than 0, the grid will be displayed.
The appearance of the figure when the options are changed is as follows.
(Same as the final code except for the line ʻax.pcolor`)
``````python
ax2 = ax.pcolor(Zm, hatch='/', edgecolor='grey',facecolor='none', linewidth=1.0)
```
``````python
ax2 = ax.pcolor(Zm, hatch='/', edgecolor='grey',linewidth=0.0)
```
``````python
ax2 = ax.pcolor(Zm, hatch='/', edgecolor='red',facecolor='none', linewidth=0.0)
```
###List of reference sites
[numpy.ma.masked_where official documentation](https://docs.scipy.org/doc/numpy/reference/generated/numpy.ma.masked_where.html)
[python – matplotlib 2.How can I fill the area with 0 with only the hatch (no background color)?](https://codeday.me/jp/qa/20190618/1041536.html)
[matplotlib.collections.Collection.set_hatch](https://matplotlib.org/3.1.1/api/collections_api.html#matplotlib.collections.Collection.set_hatch)
Recommended Posts