Magic Commands is a mechanism provided by the IPython kernel. In addition to functions related to Notebook operation, it provides utility functions such as moving directories and displaying a list of files.
Enter % at the beginning and then enter the command. The command to output the current directory is as follows.
%pwd
The magic command % pwd does not seem to be different from ! Pwd using the shell, but command execution using ! depends on the OS shell. On the other hand, magic commands depend on the functions provided by the IPython kernel.
If a magic command changes any value, you can assign the return value to a variable, just as you would when calling a Python function.
curr_dir = %pwd
curr_dir
%timeA magic command that measures the execution time of Python.
  %time sum(range(10000))
  CPU times: user 226 μs, sys: 0 ns, total: 226 μs
  Wall time: 230 μs
| output | Description |
|---|---|
| Wall time | The time it took from the start to the end of the program |
| CPU times: user | user CPU time. Time required to execute the program itself |
| sys | system CPU time. Time required for OS system call |
%timeitA magic command that summarizes and returns the measured values of the results of multiple attempts. In the following cases, the time when 1000 iterations are tried 7 times is output.
  %timeit sum(range(10000))
  224 µs ± 21.8 µs per loop (mean ± std. dev. of 7 runs, 1000 loops each)
The number of loops and the number of trials can be specified as options.
  #2000 loops, 5 trials
  %timeit -n 2000 -r 5 sum(range(10000))
  215 µs ± 17.9 µs per loop (mean ± std. dev. of 5 runs, 2000 loops each)
When measuring with% timeit for multiple lines of Python code, add two leading % to %% as shown below. (Cell magics)
  %%timeit -n 1000 -r 3

  for i in range(1000):
    i * 2

  75.2 µs ± 9.58 µs per loop (mean ± std. dev. of 3 runs, 1000 loops each)
%historyA magic command that gets a list of code cell execution histories.
  #Get the latest 5 histories
  %history -l 5
%lsA magic command that behaves like the UNIX command ls. Unlike ! Ls, % ls determines the type of OS and uses the commands to be executed internally. ( Ls command for macOS, dir command for Windows)
%autosaveYou can change the frequency of Auto Save. (Default 120 seconds)
  #Execute Auto Save once every 60 seconds.
  %autosave 60
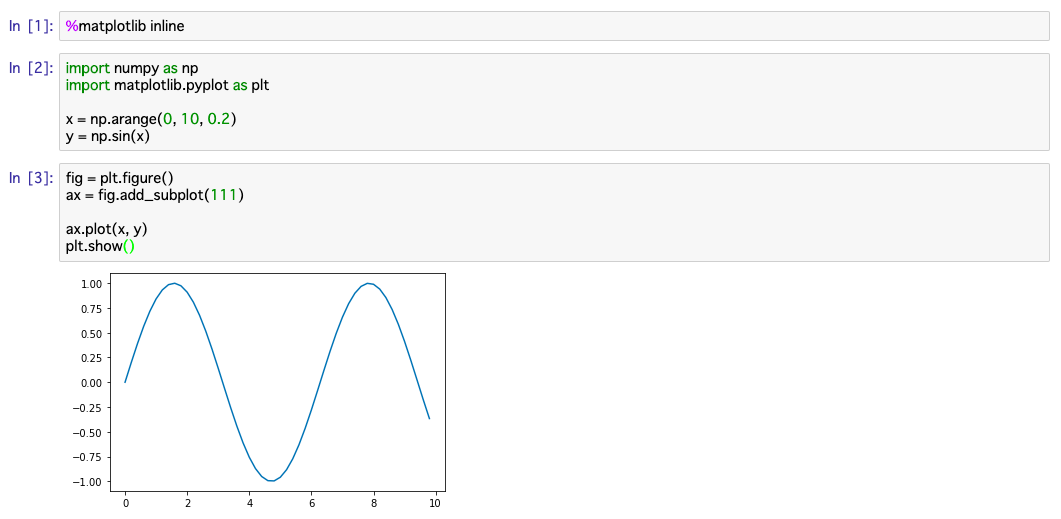
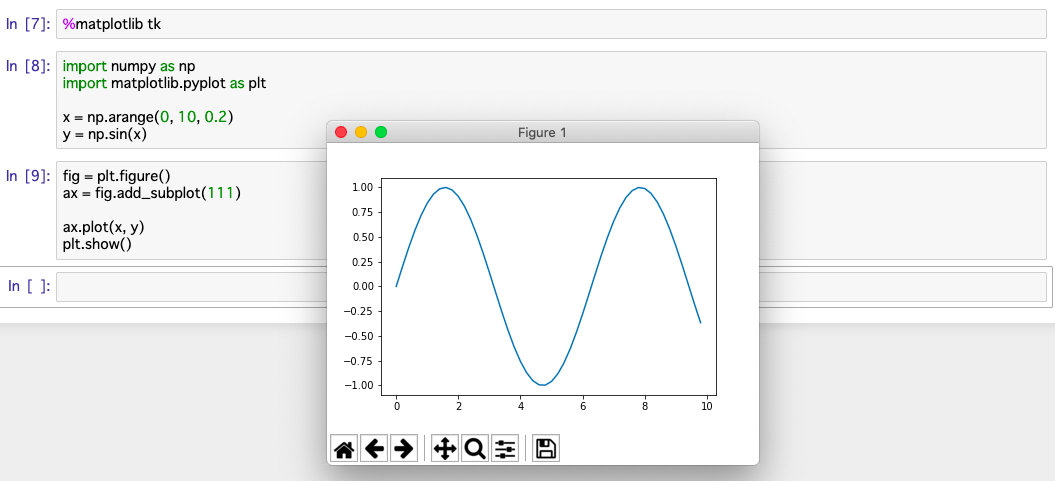
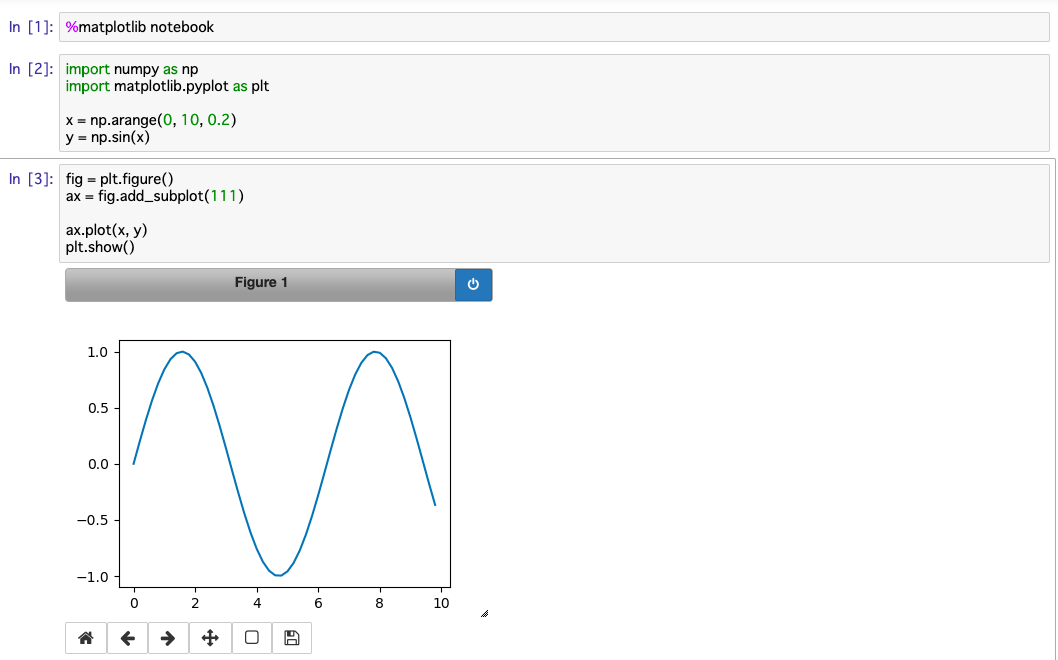
%matplotlibA magic command that configures settings related to Matplotlib.
%matplotlib inlineWhen inline is specified, the graph is drawn directly under the code cell.

%matplotlib tkIf tk is specified, an interactive graph will be output in a separate window.

%matplotlib notebookWhen notebook is specified, an interactive graph is output directly under the code cell.

--To change the output method once specified, restart the kernel.
Recommended Posts