[Python] Meine Aktienkursprognose [HFT]
1. Motivation
- Selbst wenn Sie sich Qiitas Artikel ansehen, gibt es verschiedene Artikel über Aktienkursvorhersagen, aber in diesem Artikel habe ich mich entschlossen, ernsthaft zu versuchen, Aktienkurse vorherzusagen.
- Die Aktienkursprognose hier ist eine ** kurzfristige Prognose **, die nur wenige Minuten entfernt ist.
- ** Wenn Sie sich die Börse ansehen, haben Sie möglicherweise den Eindruck, dass der Kauf stark oder der Verkauf hoch ist. Bei diesem Ansatz wird jedoch der Aktienkurs auf dieser Grundlage vorhergesagt.
- Ich bezog mich auf das Papier "Deep Convolutional Neural Networks for Limit Order Books". Limit Order Book (LOB) bezeichnet Board-Informationen.
- Darüber hinaus verwendet der Datensatz Daten der finnischen Börse Helsinki mit dem Namen FI-2010.
2. Informationen zum Board
- Informationen zum Board finden Sie im Artikel Zai Online auf leicht verständliche Weise. Einfach ausgedrückt ist ein Board eine Sammlung der folgenden Verkaufs- und Kaufbedürfnisse. Kauf- und Verkaufsaufträge verschiedener Personen werden an der Börse gesammelt. ●● Aufträge wie der Kauf (Verkauf) von XX Aktien in Yen werden nach Preis aggregiert und die Gesamtzahl der Aktien angezeigt.
| Verkaufsmenge(ASK) | Standard Preis | Menge kaufen(BID) |
|---|---|---|
| 500 | 670 | |
| 400 | 669 | |
| 600 | 668 | |
| 667 | 300 | |
| 666 | 1,200 | |
| 665 | 400 |
- Es gibt verschiedene Möglichkeiten, darüber nachzudenken, warum und wie der Aktienkurs schwankt. Hier denken wir jedoch, dass der Aktienkurs steigen wird, wenn die Verkaufsmenge der Personen, die kaufen möchten, größer ist als die Verkaufsmenge der Personen, die verkaufen möchten.
- Betrachten Sie im obigen Beispiel den Fall, in dem eine Person, die 100 Aktien kaufen möchte, erscheint und eine neue Bestellung aufgibt. Es gibt ungefähr zwei Muster für die Bestellung.
- Die erste Methode besteht darin, Ihre eigene Kauforder zu treffen, obwohl es eine Verkaufsorder für 600 Aktien für 668 Yen gibt. Zu diesem Zeitpunkt ändert sich die Karte wie unten gezeigt.
| ASK | Standard Preis | BID |
|---|---|---|
| 500 | 670 | |
| 400 | 669 | |
| 500 | 668 | |
| 667 | 300 | |
| 666 | 1,200 | |
| 665 | 400 |
- Die andere Möglichkeit besteht darin, beispielsweise eine Kaufbestellung für 667 Yen aufzugeben. Es ist nicht immer ein Vertrag, aber der Kauf wird abgeschlossen, wenn ein Verkaufsauftrag bei 667 Yen eingeht. Zu diesem Zeitpunkt ändert sich die Karte wie unten gezeigt.
| ASK | Standard Preis | BID |
|---|---|---|
| 500 | 670 | |
| 400 | 669 | |
| 600 | 668 | |
| 667 | 400 | |
| 666 | 1,200 | |
| 665 | 400 |
- Was ich hier sagen möchte, ist wie folgt.
- Wenn die Anzahl der Personen, die kaufen möchten, zunimmt, sind die Board-Informationen eine Reaktion darauf, dass ** die Menge an ASK abnimmt oder die Menge an BID zunimmt **.
- Wenn die Anzahl der Personen, die verkaufen möchten, zunimmt, sind die Board-Informationen eine Reaktion darauf, dass ** die Menge an ASK zunimmt oder die Menge an BID abnimmt **.
- ** Haben Sie das Gefühl, dass Sie, wenn Sie die Board-Informationen sorgfältig befolgen, einige Vorschläge für den nachfolgenden Aktienkursübergang erhalten können **? ??
3. FI-2010-Datensatz
Was ist der FI-2010-Datensatz?
- Das Dokument Benchmark-Datensatz für die Mid-Price-Prognose von Limit-Orderbuchdaten mit Methoden des maschinellen Lernens enthält eine ausführliche Erläuterung. Das Folgende ist ein Auszug daraus.
- Board-Informationsdaten von der Helsinki Exchange in Finnland.
- Daten für den Zeitraum vom 1. bis 14. Juni 2010.
- Die Zielaktien sind 5 Aktien. Kesco (KESBV), Out Kumpu (OUT1V), Sampo Konzern (SAMPO), Rotor Rookie (RTRKS), Balchira (WET1V). Ich kannte nicht alle Marken.
- Es scheint, dass die Daten jedes Mal abgetastet werden, wenn sich die Karte ändert. (Ich habe das Gefühl, dass die Anzahl der Daten dafür gering ist, daher kann mein Verständnis hier anders sein. Ich weiß es jedoch nicht, weil es 2010 ist.)
- Sie können die normalisierten Daten herunterladen. Die folgenden drei Arten der Normalisierung sind verfügbar.
- Z-score
\quad x_i^{Zscore} = \frac{x_i - x_{mean}}{x_{std}} \quad \rm where \quad x_{mean} = \frac{1}{N} \sum_{j=1}^{N} x_j, \quad x_{std} = \sqrt{\frac{1}{N} \sum_{j=1}^{N} (x_j - x_{mean})^2} - Min-Max Scaling
\quad x_i^{(MM)} = \frac{x_i - x_{min}}{x_{max} - x_{min}} - Decimal Precision
\quad x_i^{DP} = \frac{x_i}{10^k} \quad where k is the integer that will give the maximum value for|x_i^{(DP)}|<1 - Klicken Sie hier auf den Link (https://etsin.avointiede.fi/dataset/urn-nbn-fi-csc-kata20170601153214969115) Datenverfügbarkeit Greifen Sie frei auf diesen Datensatz zu.
Datenübersicht
- Im Folgenden werden die durch Dezimalgenauigkeit normalisierten Daten betrachtet. Dies liegt daran, dass es meiner Meinung nach am einfachsten ist, die Zahlen in den Daten intuitiv zu verstehen. Zunächst können Sie die Daten des ersten Tages aus allen 10 Datentagen lesen.
data = pd.read_csv('Train_Dst_Auction_DecPre_CF_1.txt',
                   header=None, delim_whitespace=True)
print(data.shape)
#=> (149, 47342)
- Insgesamt gibt es 47.342 Daten, und Sie können sehen, dass jedes aus 149 Elementen besteht.
- Es ist schwer, das ganze Bild zu erfassen, also schauen wir uns die Heatmap an.
plt.figure(figsize=(20,10))
plt.imshow(data, interpolation='nearest', vmin=0, vmax=0.75,
           cmap='jet', aspect=data.shape[1]/data.shape[0])
plt.colorbar()
plt.grid(False)
plt.show()
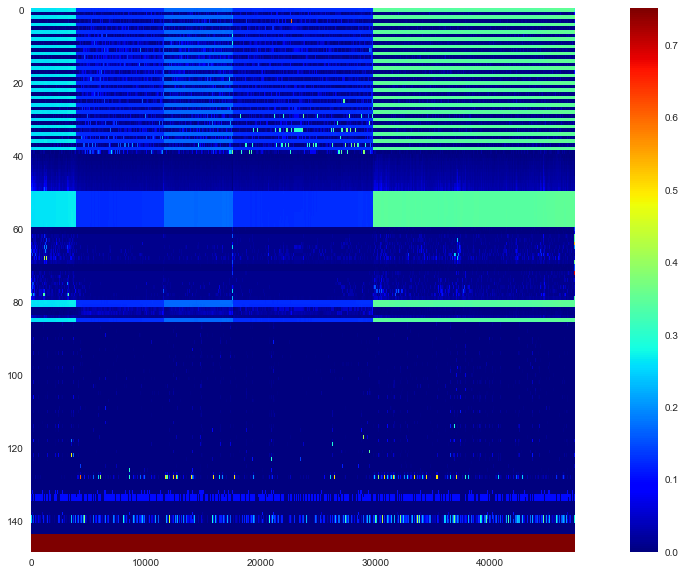
- Wenn Sie sich das ansehen, können Sie sehen, dass die Daten von 5 Marken nebeneinander verbunden sind. Die 144 Zeilen von oben stehen für Features und die letzten 5 Zeilen für Beschriftungen. Darüber hinaus enthält das Dokument die folgende Beschreibung der spezifischen Merkmalsmenge.
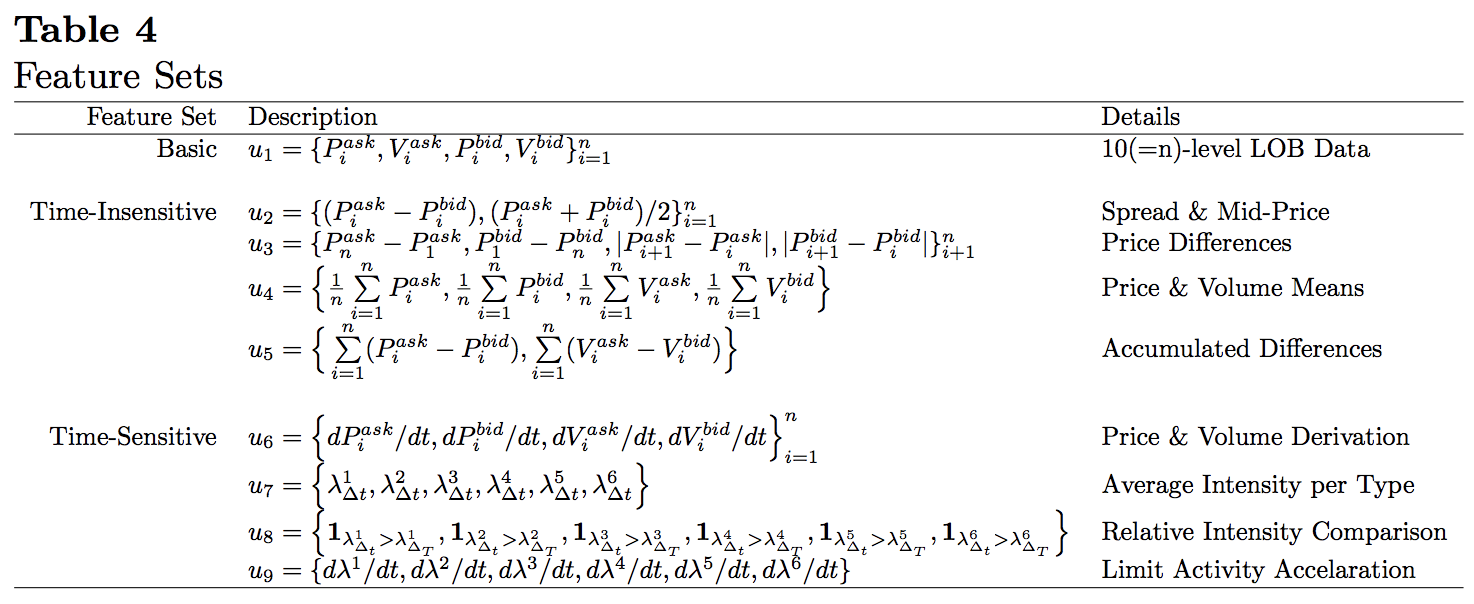
- Grundlegende Board-Informationen sind in 40 Zeilen von $ u_1 $ angegeben. Danach ist es eine Merkmalsmenge, die durch Verarbeiten von Karteninformationen erstellt wird. Schauen wir uns genauer an, wie die Daten in den Board-Informationen enthalten sind. Verwenden Sie die erste Spalte als Test.
lob = data.iloc[:40,0].values
lob_df = pd.DataFrame(lob.reshape(10,4),
                      columns=['ask','ask_vol','bid','bid_vol'])
print(lob_df)
| ask | ask_vol | bid | bid_vol | |
|---|---|---|---|---|
| 0 | 0.2631 | 0.00392 | 0.2616 | 0.00663 |
| 1 | 0.2643 | 0.00028 | 0.2615 | 0.00500 |
| 2 | 0.2663 | 0.00165 | 0.2614 | 0.00500 |
| 3 | 0.2664 | 0.00500 | 0.2613 | 0.00043 |
| 4 | 0.2667 | 0.00039 | 0.2612 | 0.00646 |
| 5 | 0.2710 | 0.00700 | 0.2611 | 0.00200 |
| 6 | 0.2745 | 0.00200 | 0.2609 | 0.00199 |
| 7 | 0.2749 | 0.00487 | 0.2602 | 0.00081 |
| 8 | 0.2750 | 0.00300 | 0.2600 | 0.00197 |
| 9 | 0.2769 | 0.01000 | 0.2581 | 0.01321 |
- Es ist leicht zu verstehen, wenn Sie hierher kommen. Die besten ASK- und BID-Werte stehen ganz oben, und die Board-Informationen werden allmählich weit vom besten Zeichen entfernt.
$ \ quad u_1 = \ {P_i ^ {ask}, V_i ^ {ask}, P_i ^ {bid}, V_i ^ {bid} \} _ {i = 1} ^ {10} $
Wie in> beschrieben, sind die Daten in 40 Zeilen in Form von "1. (bester) ASK-Preis, ASK-Menge, BID-Preis, BID-Menge, 2. ASK-Preis, ASK-Menge, BID-Preis, BID-Menge ..." angegeben. Es ist gespeichert in.
4. Modell
Trainingsdaten und Etiketten
- Von hier aus erklären wir das tatsächlich verwendete Modell des maschinellen Lernens. Trainingsdaten $ \ mathbb X $ und die entsprechende Bezeichnung $ \ mathbb y $ sind für das Training erforderlich, aber es sind ungefähr $ (\ mathbb x_t, y_t) $, aus denen dies besteht.
- ** Zum Lernen verwendete Daten **, aber irgendwann $ t $ Board-Daten
$ \ quad v_t = \ {P_ {t, i} ^ {ask}, V_ {t, i} ^ {frage}, P_ {t, i} ^ {Gebot}, V_ {t, i} ^ {Gebot} \} _ {i = 1} ^ {10} $
und dies ist das neueste $ p Die Sammlung von $ Teilen wird als eine Trainingsdaten betrachtet ($ \ mathbb x \ _t $). Insbesondere
$ \ quad \ mathbb x \ _t = \ begin {pmatrix} v \ _ {t-p + 1} \\ v \ _ {t-p + 2} \\ \ vdots \\ v \ _t \ end {pmatrix} = \ begin {pmatrix} P \ _ {t-p + 1,1} ^ {ask} & V \ _ {t-p + 1,1} ^ {ask} & P \ _ {t-p + 1,1} ^ {Gebot} & V \ _ {t-p + 1,1} ^ {Gebot} & P \ _ {t-p + 1,2} ^ {fragen } & \ cdots & P \ _ {t-p + 1,10} ^ {bid} & V \ _ {t-p + 1,10} ^ {bid} \\ P \ _ {t-p + 2 , 1} ^ {ask} & V \ _ {t-p + 2,1} ^ {ask} & P \ _ {t-p + 2,1} ^ {bid} & V \ _ {t-p + 2,1} ^ {Gebot} & P \ _ {t-p + 2,2} ^ {fragen} & \ cdots & P \ _ {t-p + 2,10} ^ {Gebot} & V \ _ { t-p + 2,10} ^ {bid} \\ \ vdots & \ vdots & \ vdots & \ vdots & \ vdots & \ ddots & \ vdots & \ vdots \\ P \ _ {t, 1} ^ {ask} & V \ _ {t, 1} ^ {ask} & P \ _ {t, 1} ^ {bid} & V \ _ {t, 1} ^ {bid} & P \ _ {t, 2 } ^ {ask} & \ cdots & P \ _ {t, 10} ^ {bid} & V \ _ {t, 10} ^ {bid} \ end {pmatrix} $
$ p × 40 $ Es wird eine Warteschlange sein. Nachdem dies mit CNN gefaltet wurde, wird es durch LSTM geleitet, sodass sich die ältesten Daten in der ersten Zeile und die Daten bei $ t $ in der unteren Zeile befinden. - ** Label ** ($ y_t $) gibt an, ob der durchschnittliche Mittelpunktspreis für die $ k $ -Periode nach $ t $ steigt, fällt oder sich basierend auf dem Schwellenwert $ \ alpha $ abflacht. Zuweisen zu und. Erstens ist der Mittelpunkt ($ p_t $) der Durchschnitt der besten ASK und BID zu jedem Zeitpunkt, also
$ \ quad p_t = \ frac {P_ {t, 1} ^ {ask} + P_ { Es wird t, 1} ^ {bid}} {2} $
. Darüber hinaus sind der Durchschnittswert des Mittelpunkts ($ m_ {+} (t)) und seine Zu- / Abnahmerate ( l_t $) in der Periode $ k $
$ \ quad m_ {+} (t) = \ frac {1} {k} \ sum_ {i = 1} ^ {k} p_ {t + i}, \ quad l_t = \ frac {m_ {+} (t) --p_t} {p_t} $
tun können. Basierend auf dem Schwellenwert ($ \ alpha $) wird
$ \ quad y_t = \ left \ {\ begin {array} {} 1, & l_t> \ alpha \\ -1, & l_t < - \ alpha \\ 0, & \ rm sonst \ end {array} \ right. $
Beschriften Sie es.
Modellarchitektur
- Das Folgende ist zuerst ein Beispiel des Modells. Zuerst werden die Karteninformationen zu jedem Zeitpunkt von CNN gefaltet, und schließlich wird die Zeitreihenbeziehung von LSTM verarbeitet.
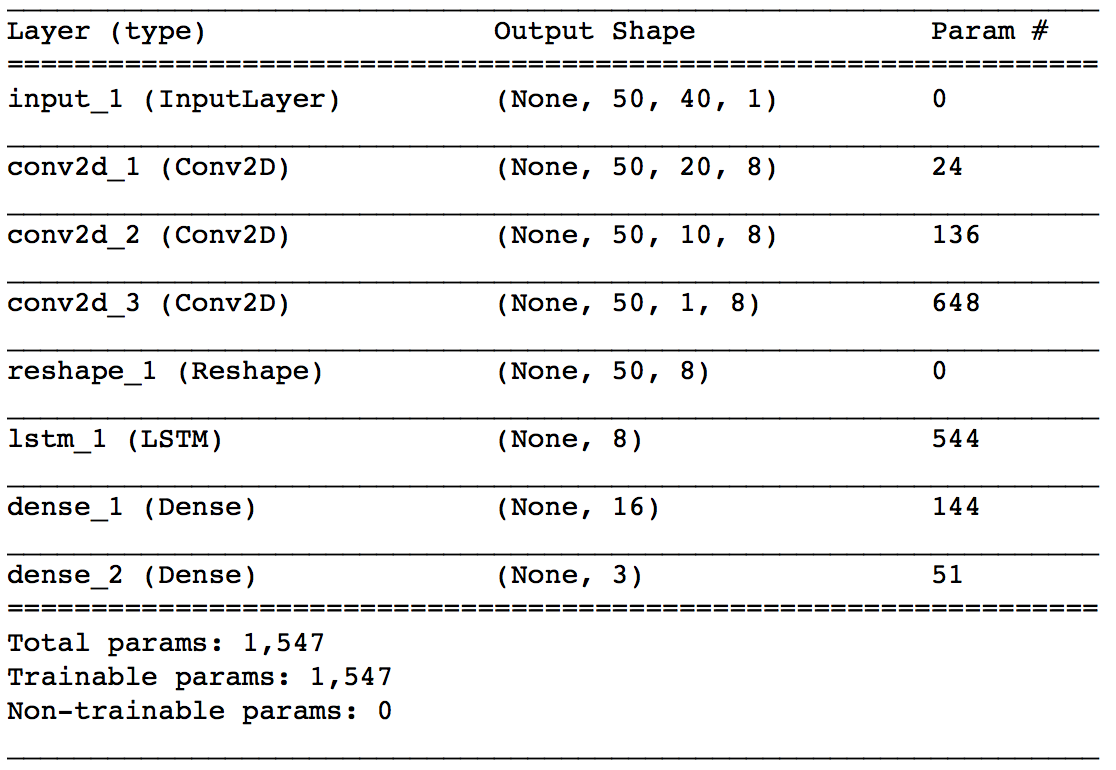
- ** input_1 ** Beginnen wir mit den Ebenen. Ausgangsform bedeutet (Stapelgröße, Anzahl der zu verweisenden Karteninformationen ($ p $), Anzahl der in einer Karteninformation enthaltenen Daten (40), 1). Hier ist $ p = 50 $.
- ** conv2d_1 ** Die Schicht ist die erste Faltungsschicht. Die Größe des Kernels beträgt $ 1 x 2 $ und der Schritt beträgt $ 1 x 2 $. Die Preis- und Mengenpaare der Board-Informationen sind in $ \ mathbb x_t $ aufgeführt, aber hier falten wir jedes Paar zusammen. Die Anzahl der Kernel wird mit 8 angegeben. Hier wird nur das Falten in Zeilenrichtung durchgeführt, sodass die Anzahl der Karteninformationen, auf die durch die Ausgabeform verwiesen wird, unverändert bei $ p (= 50) $ bleibt und die Anzahl der in einer Karteninformation enthaltenen Daten halbiert wird. Ich werde.
Die * ** conv2d_2 ** -Schicht ist auch eine Faltungsschicht mit einer Kernelgröße von $ 1x2 $ und einem Schritt von $ 1x2
. Die Anzahl der Kernel wird mit 8 angegeben. Die Faltung hier ist für die Tafel Information "ASK-Seitenpreis / Menge gefaltet mit conv2d_1" und "BID-Seitenpreis / Menge gefaltet mit conv2d_1", wenn das beste Zeichen Über das beste Angebot Es spielt die Rolle, die vier Zahlen ASK und BID Preis und Menge zusammenzustellen. Abhängig von den Gewichten von conv2d_1 und conv2d_2 können Sie ein kleines Bild erhalten, indem Sie denken, dass es sich wie die Berechnung des gewichteten Durchschnittsmittelpunkts der entsprechenden ASK und BID verhält. Dieser gewichtete durchschnittliche Mittelpunkt wird auch als Mikropreis ( p_t ^ {(micro)} $) bezeichnet und ist wie folgt definiert.
$ \ quad p_ {t, i} ^ {(Mikro)} = \ frac {P_ \ {t, i} ^ {frage} V_ \ {t, i} ^ {frage} + P_ \ {t, i} ^ {bid} V_ \ {t, i} ^ {bid}} {V_ \ {t, i} ^ {ask} + V_ \ {t, i} ^ {bid}} $ - ** Die Conv2d_3 ** -Schicht ist eine Faltungsschicht mit einer Kernelgröße von $ 1 x 10 $ und einem Schritt von $ 1 $. Die Anzahl der Kernel wird mit 8 angegeben. Erstens beziehen sich beide Seiten von ASK und BID auf 10 Karten, sodass die Ausgabe von conv2d_2 aus 10 Zahlen für jede Karteninformation besteht. Es ist diese Ebene, die diese 10 Zahlen zusammenfaltet. Die Board-Informationen zu diesem Zeitpunkt wurden zu einer Nummer zusammengefasst. Die Ebene * ** reshape_1 ** dient dazu, die Ausgabe von conv2d_3 dem nächsten lstm_1 zuzuführen. Die Ebene * ** ltsm_1 ** versucht, die Zeitreihenbeziehungen der bisher gefalteten Karteninformationen zu erfassen. Die Anzahl der Einheiten gibt 8 an. Die Ebene * ** dens_1 ** ist eine einfache verborgene Ebene, die die Ausgabe von LSTM empfängt. Die * ** dens_2 ** -Schicht ist die Ausgabeschicht für dieses Netzwerk. Je nach Anzahl der Etikettentypen werden drei Ausgänge verwendet, und Softmax wird zur Aktivierung verwendet.
5. Implementierung
Datenvorverarbeitung
- Hier werden wir das Modell unter Verwendung der Daten der 5. Marke mit der größten Anzahl von Proben unter den zuvor gelesenen Daten verschieben.
#Die Board-Informationen befinden sich in den ersten 40 Zeilen. 29738 als Daten der fünften Marke~Geben Sie 47294 an.
lob = data.iloc[:40, 29738:47294].T.values
#Hier nach Preis und Menge standardisieren.
lob = lob.reshape(-1,2)
lob = (lob - lob.mean(axis=0)) / lob.std(axis=0)
lob = lob.reshape(-1,40)
lob_df = pd.DataFrame(lob)
#Berechnen Sie den nicht standardisierten Mittelpunkt.
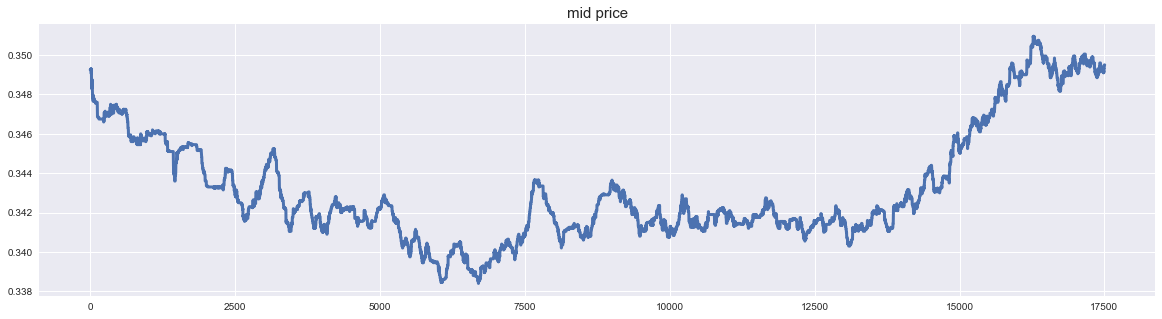
lob_df['mid'] = (data.iloc[0,29738:47294].T.values + data.iloc[2,29738:47294].T.values) / 2
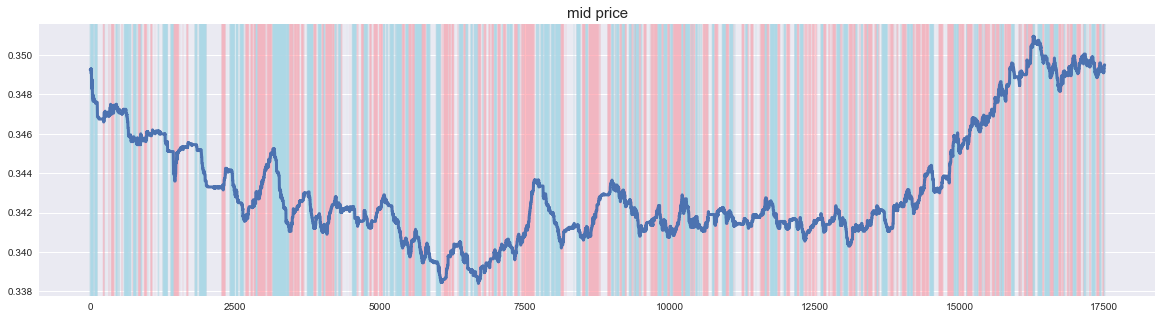
- Wenn ich den Mittelpunktspreis zeichne, sieht es wie folgt aus. Nun, es ist ein Stammaktienchart. Es besteht der Eindruck, dass es viele kleine Schwingungen gibt, da es keine Grenzpreise für alle Gebotspreise gibt, die nahe am aktuellen Preis liegen. Die Tatsache, dass es sich bei dem Aktienkurs nicht um Daten handelt, die sich in eine Richtung bewegen, scheint für die Erstellung eines Modells gut zu sein.
- Als nächstes erstellen wir ein Etikett.
#Geben Sie die Parameter an.
p = 50
k = 50
alpha = 0.0003
#Erstellen Sie eine Beschriftung vom Mittelpunkt basierend auf den Parametern.
lob_df['lt'] = (lob_df['mid'].rolling(window=k).mean().shift(-k)-lob_df['mid'])/lob_df['mid']
lob_df = lob_df.dropna()
lob_df['label'] = 0
lob_df.loc[lob_df['lt']>alpha, 'label'] = 1
lob_df.loc[lob_df['lt']<-alpha, 'label'] = -1
-
Die Beschriftung mit diesem Parameter sieht wie folgt aus. Wenn der Aktienkurs steigt, sendet er ein steigendes Signal und wenn er fällt, sendet er ein fallendes Signal.
-
Laden Sie die gewünschte Bibliothek.
from sklearn.model_selection import train_test_split
from keras.utils import to_categorical
from keras.layers import Conv2D, Dense, Reshape, Input, LSTM
from keras import Model, backend
import tensorflow as tf
- Wir erstellen Trainingsdaten.
#Trainingsdaten erstellen.
X = np.zeros((len(lob_df)-p+1, p, 40, 1))
lob = lob_df.iloc[:,:40].values
for i in range(len(lob_df)-p+1):
    X[i] = lob[i:i+p,:].reshape(p,-1,1)
y = to_categorical(lob_df['label'].iloc[p-1:], 3)
print(X.shape, y.shape)
#=> (17457, 50, 40, 1) (17457, 3)
- Teilen Sie schließlich in Trainingsdaten und Testdaten auf.
X_train, X_test, y_train, y_test = train_test_split(X, y, test_size=0.2)
- Damit ist die Vorverarbeitung abgeschlossen!
Modellbau
- Von hier aus erstellen wir ein Modell des neuronalen Netzwerks unter Verwendung von Keras. Ich bin mit der funktionalen API besser vertraut als mit Sequential, daher schreibe ich sie hier.
tf.reset_default_graph()
backend.clear_session()

inputs = Input(shape=(p,40,1))
x = Conv2D(8, kernel_size=(1,2), strides=(1,2), activation='relu')(inputs)
x = Conv2D(8, kernel_size=(1,2), strides=(1,2), activation='relu')(x)
x = Conv2D(8, kernel_size=(1,10), strides=1, activation='relu')(x)
x = Reshape((p, 8))(x)
x = LSTM(8, activation='relu')(x)
x = Dense(16, activation='relu')(x)
outputs = Dense(3, activation='softmax')(x)

model = Model(inputs=inputs, outputs=outputs)
model.compile(optimizer='adam', loss='categorical_crossentropy', metrics=['accuracy'])
Lass uns lernen!
- Alles was Sie tun müssen, ist zu lernen.
epochs = 50
batch_size = 256
history = model.fit(X_train, y_train,
                    epochs=epochs,
                    batch_size=batch_size,
                    verbose=1,
                    validation_data=(X_test, y_test))
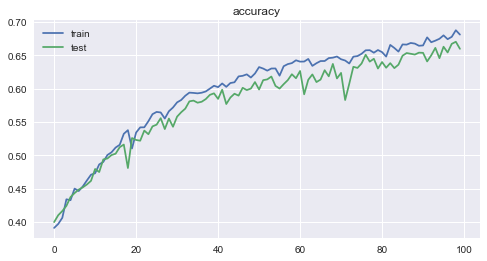
Epoch 100/100 13965/13965 [==============================] - 5s 326us/step - loss: 0.6526 - acc: 0.6808 - val_loss: 0.6984 - val_acc: 0.6595
- Der Verlust und die Genauigkeit für jede Epoche sind wie folgt. Sie können sehen, wie gut das Lernen voranschreitet.

6. Überlegung
-
Die Genauigkeit betrug 0,6808 für Trainingsdaten und 0,6595 ** für Testdaten, was ein unerwartet gutes Ergebnis war.
-
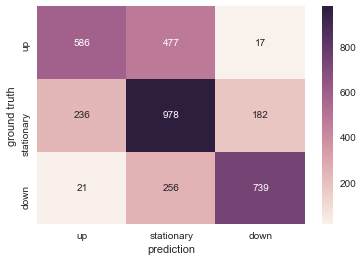
Lassen Sie uns das Ergebnis der Testdaten mit einer Heatmap visualisieren. Es ist gut, dass sie korrekt klassifiziert werden können, aber unter Berücksichtigung der praktischen Anwendung führen "ein Abwärtssignal zu geben, wenn der Aktienkurs steigt" und "ein Aufwärtssignal zu geben, wenn der Aktienkurs fällt" zu einem Verlust. Es ist also das problematischste. In dieser Hinsicht gibt es einige Fälle, in denen das entgegengesetzte Signal gegeben wird, was ein positives Ergebnis ist.
-
Zukünftige Aufgaben
-
Hyper-Parameter-Tuning.
-
Lernen Sie auch Daten von anderen Marken.
-
Lernen Sie, Daten von anderen Handelstagen zu verwenden. (Im Allgemeinen ist bekannt, dass sich die Leistung verschlechtert, selbst wenn ein Modell basierend auf den Daten eines Tages erstellt wird, wenn es an einem anderen Tag verwendet wird.)
-
Überprüfen Sie, ob an den jüngsten japanischen Aktienmärkten eine ähnliche Performance erzielt werden kann.
Recommended Posts