[PYTHON] [TF] J'ai essayé de visualiser le résultat de l'apprentissage en utilisant Tensorboard
J'ai essayé de savoir comment visualiser les résultats d'apprentissage à l'aide de Tensorboard. Pour la méthode de sortie vers Tensorboard, reportez-vous à here.
Exemple simple
Tout à coup, c'est difficile pour un compliqué, alors j'ai fait un exemple simple et l'ai essayé. Comme le montre la figure ci-dessous, les données de test étaient de 5 dimensions pour x et de 3 dimensions pour y, et après que x ait été généré aléatoirement, il a été multiplié par W spécifié à l'avance et b a été ajouté pour générer y. Puisque x est 5 dimensions et y est 3 dimensions, la taille de W est 5x3. Le code que j'ai exécuté est ci-dessous, ce qui est une légère modification du code sur la page d'accueil de Tensorflow pour correspondre aux données de test.

Les points du code sont les suivants.
- Créez un objet SummaryWriter comme
writer = tf.train.SummaryWriter (" / tmp / tensorflow_log ", sess.graph_def). À ce moment-là, spécifiez le répertoire de sortie du journal. - Récapitulez les opérations qui génèrent des données récapitulatives avec
merged = tf.merge_all_summaries (). operation signifie scalar_summary ou histogram_summary. - Incorporez l'opération dans le code.
w_hist = tf.histogram_summary (" poids ", W)Comme ça. - Exécutez fusionné une fois toutes les quelques fois (une fois toutes les 10 fois dans le code) comme
result = sess.run ([merged, loss]). La perte est pour la sortie vers la sortie standard, donc si vous voulez simplement sortir vers Tensorboard, vous n'avez pas besoin de l'exécuter. - Transmettez la valeur de retour de sess.run à écrire. Le code passe fusionné et perdu à sess.run, de sorte que le résultat revient sous forme de liste. Puisqu'il s'agit d'une personne fusionnée, passez le résultat [0] comme ceci:
writer.add_summary (summary_str, step). - Une fois l'entraînement terminé, exécutez tensorboard --logdir = / tmp / tensorflow_log.
- Démarrez Chrome dans cet état et accédez à
http: // localhost: 6006pour afficher TensorBoard, et si la sortie du journal réussit, GRAPH sera affiché.
Voici le résultat de Tensorboard et le code exécuté.
GRAPH
 EVENTS
 HISTOGRAMS
 Code
Code
python
import tensorflow as tf
import numpy as np

WW = np.array([[0.1, 0.6, -0.9],
               [0.2, 0.5, -0.8],
               [0.3, 0.4, -0.7],
               [0.4, 0.3, -0.6],
               [0.5, 0.2, -0.5]]).astype(np.float32)
bb = np.array([0.3, 0.4, 0.5]).astype(np.float32)
x_data = np.random.rand(100,5).astype(np.float32)
y_data = np.dot(x_data, WW) + bb

with tf.Session() as sess:

    W = tf.Variable(tf.random_uniform([5,3], -1.0, 1.0))
    # The zeros set to zero with all elements.
    b = tf.Variable(tf.zeros([3]))
    #y = W * x_data + b
    y = tf.matmul(x_data, W) + b

    # Add summary ops to collect data
    w_hist = tf.histogram_summary("weights", W)
    b_hist = tf.histogram_summary("biases", b)
    y_hist = tf.histogram_summary("y", y)

    # Minimize the mean squared errors.
    loss = tf.reduce_mean(tf.square(y - y_data))
    # Outputs a Summary protocol buffer with scalar values
    loss_summary = tf.scalar_summary("loss", loss)

    # Gradient descent algorithm
    optimizer = tf.train.GradientDescentOptimizer(0.5)
    train = optimizer.minimize(loss)

    # Before starting, initialize the variables.  We will 'run' this first.
    init = tf.initialize_all_variables()

    # Creates a SummaryWriter
    # Merges all summaries collected in the default graph
    merged = tf.merge_all_summaries()
    writer = tf.train.SummaryWriter("/tmp/tensorflow_log", sess.graph_def)
    sess.run(init)

    # Fit the line
    for step in xrange(501):
        if step % 10 == 0:
            result = sess.run([merged, loss])
            summary_str = result[0]
            acc = result[1]
            writer.add_summary(summary_str, step)
            print"step = %s acc = %s W = %s b = %s" % (step, acc, sess.run(W), sess.run(b))
        else:
            sess.run(train)
Un exemple un peu plus compliqué
Lorsque vous récapitulez des histogrammes, faites de la même manière le xxx des histogrammes que vous souhaitez résumer, comme tf.histogram_summary (" xxx / weights ", w), tf.histogram_summary (" xxx / biases ", b).
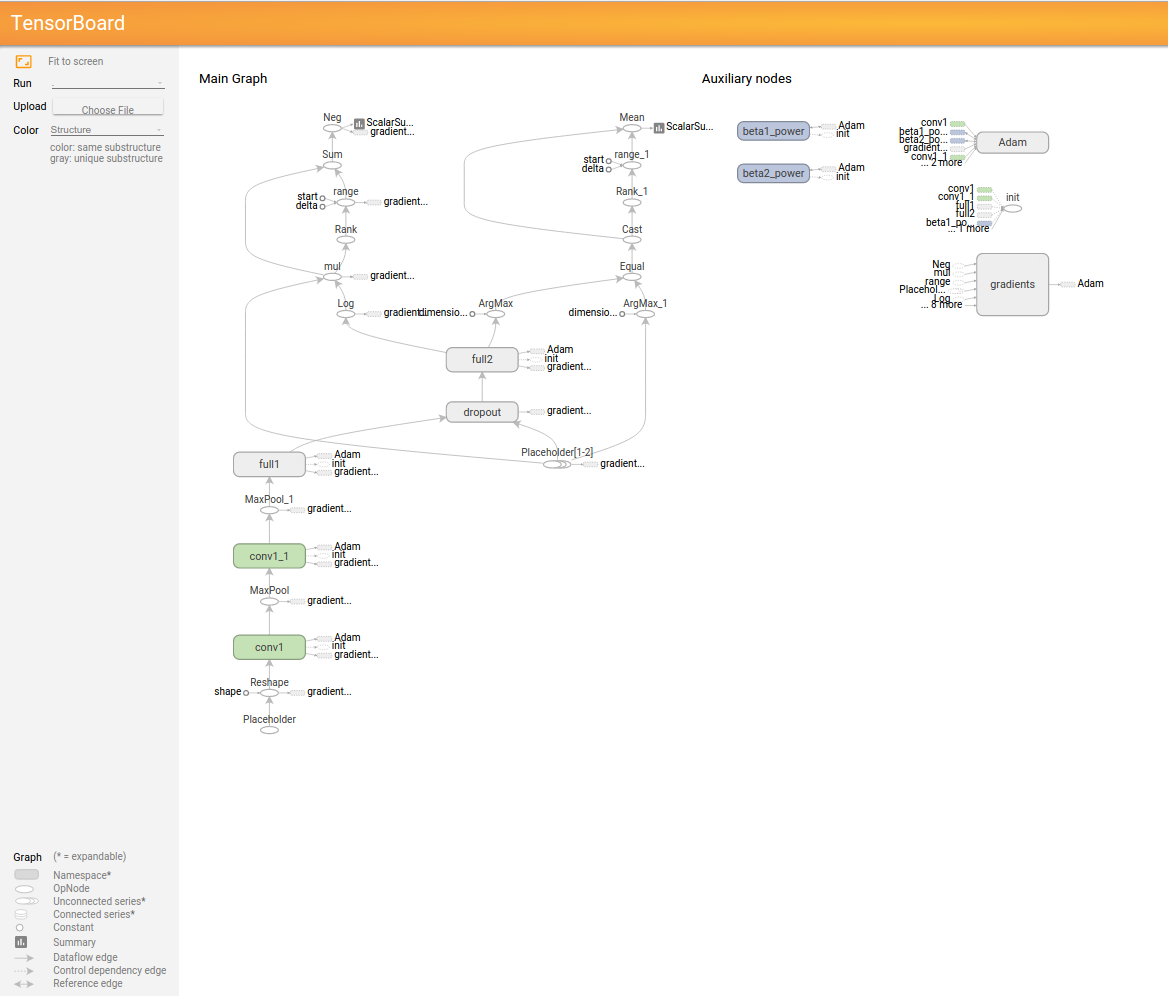
Voici le résultat de Tensorboard et le code exécuté.
GRAPH
 EVENTS
 HISTOGRAMS
 Code
Code
python
import input_data
import tensorflow as tf

print 'load MNIST dataset'
mnist = input_data.read_data_sets("MNIST_data", one_hot=True)

def weight_variable(shape):
    initial = tf.truncated_normal(shape, stddev=0.1)
    return tf.Variable(initial)

def bias_variable(shape):
    initial = tf.constant(0.1, shape = shape)
    return tf.Variable(initial)

def conv2d(x, W):
    return tf.nn.conv2d(x, W, strides=[1,1,1,1], padding='SAME')
def max_pool_2x2(x):
    return tf.nn.max_pool(x, ksize=[1,2,2,1], strides=[1,2,2,1], padding='SAME')

def _write_histogram_summary(parent, infos):
    for i in infos:
        tf.histogram_summary("%s/%s" % (parent, i[0]), i[1])

with tf.Session() as sess:
    x = tf.placeholder("float", [None, 784])
    y_ = tf.placeholder("float", [None, 10])

    # 1x28x28 -> 32x28x28 -> 32x14x14
    x_image = tf.reshape(x, [-1,28,28,1])
    with tf.variable_scope('conv1') as scope:
        W_conv1 = weight_variable([5, 5, 1, 32])
        b_conv1 = bias_variable([32])
        h_conv1 = tf.nn.relu(conv2d(x_image, W_conv1) + b_conv1, name=scope.name)

        _write_histogram_summary('conv1', [['weights', W_conv1],['biases', b_conv1], ['activations', h_conv1]])

    h_pool1 = max_pool_2x2(h_conv1)

    # 32x14x14 -> 64x7x7
    with tf.variable_scope('conv1') as scope:
        W_conv2 = weight_variable([5, 5, 32, 64])
        b_conv2 = bias_variable([64])
        h_conv2 = tf.nn.relu(conv2d(h_pool1, W_conv2) + b_conv2, name=scope.name)

        _write_histogram_summary('conv2', [['weights', W_conv2],['biases', b_conv2], ['activations', h_conv2]])

    h_pool2 = max_pool_2x2(h_conv2)

    # 64x7x7 -> 1024
    with tf.variable_scope('full1') as scope:
        W_fc1 = weight_variable([7 * 7 * 64, 1024])
        b_fc1 = bias_variable([1024])
        h_pool2_flat = tf.reshape(h_pool2, [-1, 7*7*64])
        h_fc1 = tf.nn.relu(tf.matmul(h_pool2_flat, W_fc1) + b_fc1, name=scope.name)

        _write_histogram_summary('full1', [['weights', W_fc1],['biases', b_fc1], ['activations', h_fc1]])

    # dropout
    keep_prob = tf.placeholder("float")
    h_fc1_drop = tf.nn.dropout(h_fc1, keep_prob)

    # Readout
    with tf.variable_scope('full2') as scope:
        W_fc2 = weight_variable([1024, 10])
        b_fc2 = bias_variable([10])

        y_conv=tf.nn.softmax(tf.matmul(h_fc1_drop, W_fc2) + b_fc2, name=scope.name)

        _write_histogram_summary('full2', [['weights', W_fc2],['biases', b_fc2]])

    tf.histogram_summary("y", y_conv)

    cross_entropy = -tf.reduce_sum(y_*tf.log(y_conv))

    train_step = tf.train.AdamOptimizer(1e-4).minimize(cross_entropy)
    correct_prediction = tf.equal(tf.argmax(y_conv,1), tf.argmax(y_,1))
    accuracy = tf.reduce_mean(tf.cast(correct_prediction, "float"))


    tf.scalar_summary("cross_entropy", cross_entropy)
    tf.scalar_summary("accuracy", accuracy)

    # Before starting, initialize the variables.  We will 'run' this first.
    init = tf.initialize_all_variables()

    # Creates a SummaryWriter
    # Merges all summaries collected in the default graph
    merged = tf.merge_all_summaries()
    writer = tf.train.SummaryWriter("/tmp/tensorflow_log_mnist", sess.graph_def)

    sess.run(init)

    # training
    N = len(mnist.train.images)
    N_test = len(mnist.test.images)
    n_epoch = 20000
    batchsize = 50

    for i in range(n_epoch):
        batch = mnist.train.next_batch(batchsize)
        if i%100 == 0:
            summary_str, loss_value = sess.run([merged, accuracy], feed_dict={x: batch[0], y_: batch[1], keep_prob: 0.5})
            writer.add_summary(summary_str, i)
            print "step %d %.2f" % (i, loss_value)
        sess.run(train_step, feed_dict={x: batch[0], y_: batch[1], keep_prob: 0.5})

    tacc = 0
    tbatchsize = 1000
    for i in range(0,N_test,tbatchsize):
        acc = sess.run(accuracy, feed_dict={
        x: mnist.test.images[i:i+tbatchsize], y_: mnist.test.labels[i:i+tbatchsize], keep_prob: 1.0})
        tacc += acc * tbatchsize

        print "test step %d acc = %.2f" % (i//tbatchsize, acc)
    tacc /= N_test
    print "test accuracy %.2f" % tacc