[PYTHON] [For beginners] Baseball statistics and PyData that can be remembered in 33 minutes and 4 seconds ~ With Dai-Kang Yang
It is fun I stove league Hello!
In this entry, I would like to introduce an example of baseball statistics "Sabermetrics" using professional baseball, which everyone loves, and pandas, which is popular in the streets recently and is also used for both work and hobbies.
In addition, this article is Python Advent Calendar 2016 12/4 minutes article & ** Until you read the article and copy the code and move it The time required for is assumed to be about 33 minutes and 4 seconds. **
Starting Menmber
- Self-introduction
- Sabermetrics to understand in 10 minutes (baseball statistics)
- Take a quick look at the batter's characteristics with Python + Pandas in 20 minutes
- Summary (3 minutes 4 seconds)
In addition, this article wrote in the past "Let's see how great the batter Shohei Ohtani is with just a few lines of Python code ”Is newly transcribed from the perspective of Python programming & baseball statistics.
Self-introduction
- shinyorke (read as Shinyoku)
- I am an engineer at an HR (Human Resources) startup.
- Web application development with Django (with everyone) & database / analysis team member (one person)
- A little over 5 years of Python experience
- If you search for "baseball Python", you will find various results (results).
Sabermetrics to understand in 10 minutes (baseball statistics)
Write Python code and analyze the batter! Before ..., I would like to introduce you to Sabermetrics.
If you write it properly, it will not end even if it takes a whole day, so I will introduce only the points necessary for Hack in the future.
What is Sabermetrics?
This is a quote from Wikipedia (Sabermetrics).
Sabermetrics (SABRmetrics, Sabermetrics) is an analysis method that objectively analyzes data from a statistical point of view in baseball and considers player evaluations and strategies. ** **
Batting average, RBI, home run, victory, ERA, error, etc ... There are various indicators in baseball, but once these are set aside, an index for "objective analysis" is created based on the "hypothesis". , "Thinking about player evaluation / strategy" analysis method and its idea are Sabermetrics.
The index is made by making full use of existing data (score data such as hits, hits, pitching innings, etc.) and detailed sensor data captured by a speed gun or camera / radar.
This time, we will use score data (sensor data does not exist much on the Web in the first place).
Basic idea of Sabermetrics
It is OK if you catch the following three.
-
** The winning percentage is 50% when the team's goal difference is zero (Pythagorean expectation) **
-
** It is justice for the batter to "do not go out" and "go to the previous base"! ** **
-
** Pitchers & fielders should "take as many outs as possible" and "don't let the opponent aim at the front base"! ** **
-
has the idea of "[Pythagorean expectation](https://ja.wikipedia.org/wiki/Pythagorean expectation)", and this winning percentage prediction is the basis of all baseball statistics.
** If the goal is zero, 50%, plus is a savings, and minus is a high possibility of debt. **
Also, baseball will continue to attack unless you get three outs, so
- Batters increase points, so it is best to play without getting out (hits, four dead balls, etc.)
- Pitchers and fielders should catch as many outs as possible to reduce runs (strikeout, ground ball, fly, stolen base prevention)
Should be cherished! You can see the guideline.
(There are various theories & I admit the objection) Sabermetrics avoids "play with a high risk of being out" such as sacrifice bunts and stolen bases.
I want to know a little more! For those who say, Article explained in 30 minutes (This is my past article & introduce the background and simple use cases Please refer to this because there is (Stemma)
Take a quick look at the batter's characteristics with Python + Pandas in 20 minutes
Here is the topic of programming at last (wait, Suimasen).
Let's actually use Python.
things to do
- Calculate the Sabermetrics index of Dai-Kang Yang, who declared FA from the Hokkaido Nippon-Ham Fighters, and observe the changes from year to year.
- Data source is borrowed from NPB official (low voice)
Advance preparation
- Environment where Python 3.4 or higher works (newer is better)
- Virtual environments such as venv, virtualenv (no dangerous library code, but don't dig into the OS guys)
- Package management. Recommended is pip, "No, I saw anaconda in another article and used it!" Is anaconda or whatever you like.
This article is
- Virtual environment where Python 3.5.2 runs with pyenv + virtualenv
- Package management is pip
- macOS 10.12.1(Sierra)
I will explain on the premise of (I hope you can read it according to your own environment)
& Fragmented code snippets will appear, but I'll also give you the last one.
(To put it plainly, if you copy the last one, you should be able to imitate it)
Library installation
This time, write the code with the following configuration.
- Execution environment is Jupyter (reads and writes based on IPython and notebook)
- Pandas for data acquisition / preprocessing / calculation
- Library to mess with html, such as beautifulsoup4, which is necessary for data acquisition (pandas partially depends)
- Graph drawing (matplotlib, seaborn)
If you are using pip, it is enough to execute this one line (please read it well for people such as anaconda).
> $ pip install ipython pandas beautifulsoup4 numpy lxml html5lib jupyter matplotlib seaborn
Start the environment
Start Jupyter notebook.
> $ jupyter notebook
Data frame acquisition and cleaning (pre-processing)
Library import etc.
Since I will write a graph, I will write a Magic Function (the one that starts with%) & import pandas.
By the way, specify the number of columns and rows to display in the notebook to facilitate subsequent debugging.
%matplotlib inline
import pandas

#Increase display columns / rows(30 rows,10 lines)

pandas.options.display.max_columns = 30
pandas.options.display.max_rows = 10
Get dataframe
Get it with pandas' read_html method.
On the back side, I used beautifulsoup, html5lib, etc. to scrape the Table tag.
url = 'http://npb.jp/bis/players/21825112.html'  #Dai-Kang Yang's HP(npb.jp)
df = pandas.io.html.read_html(url)  #Scraping the table tag! List of df(The contents are pandas.core.frame.DataFrame object)Will return with
There are multiple tables on this page, so find out which row is the batting score.
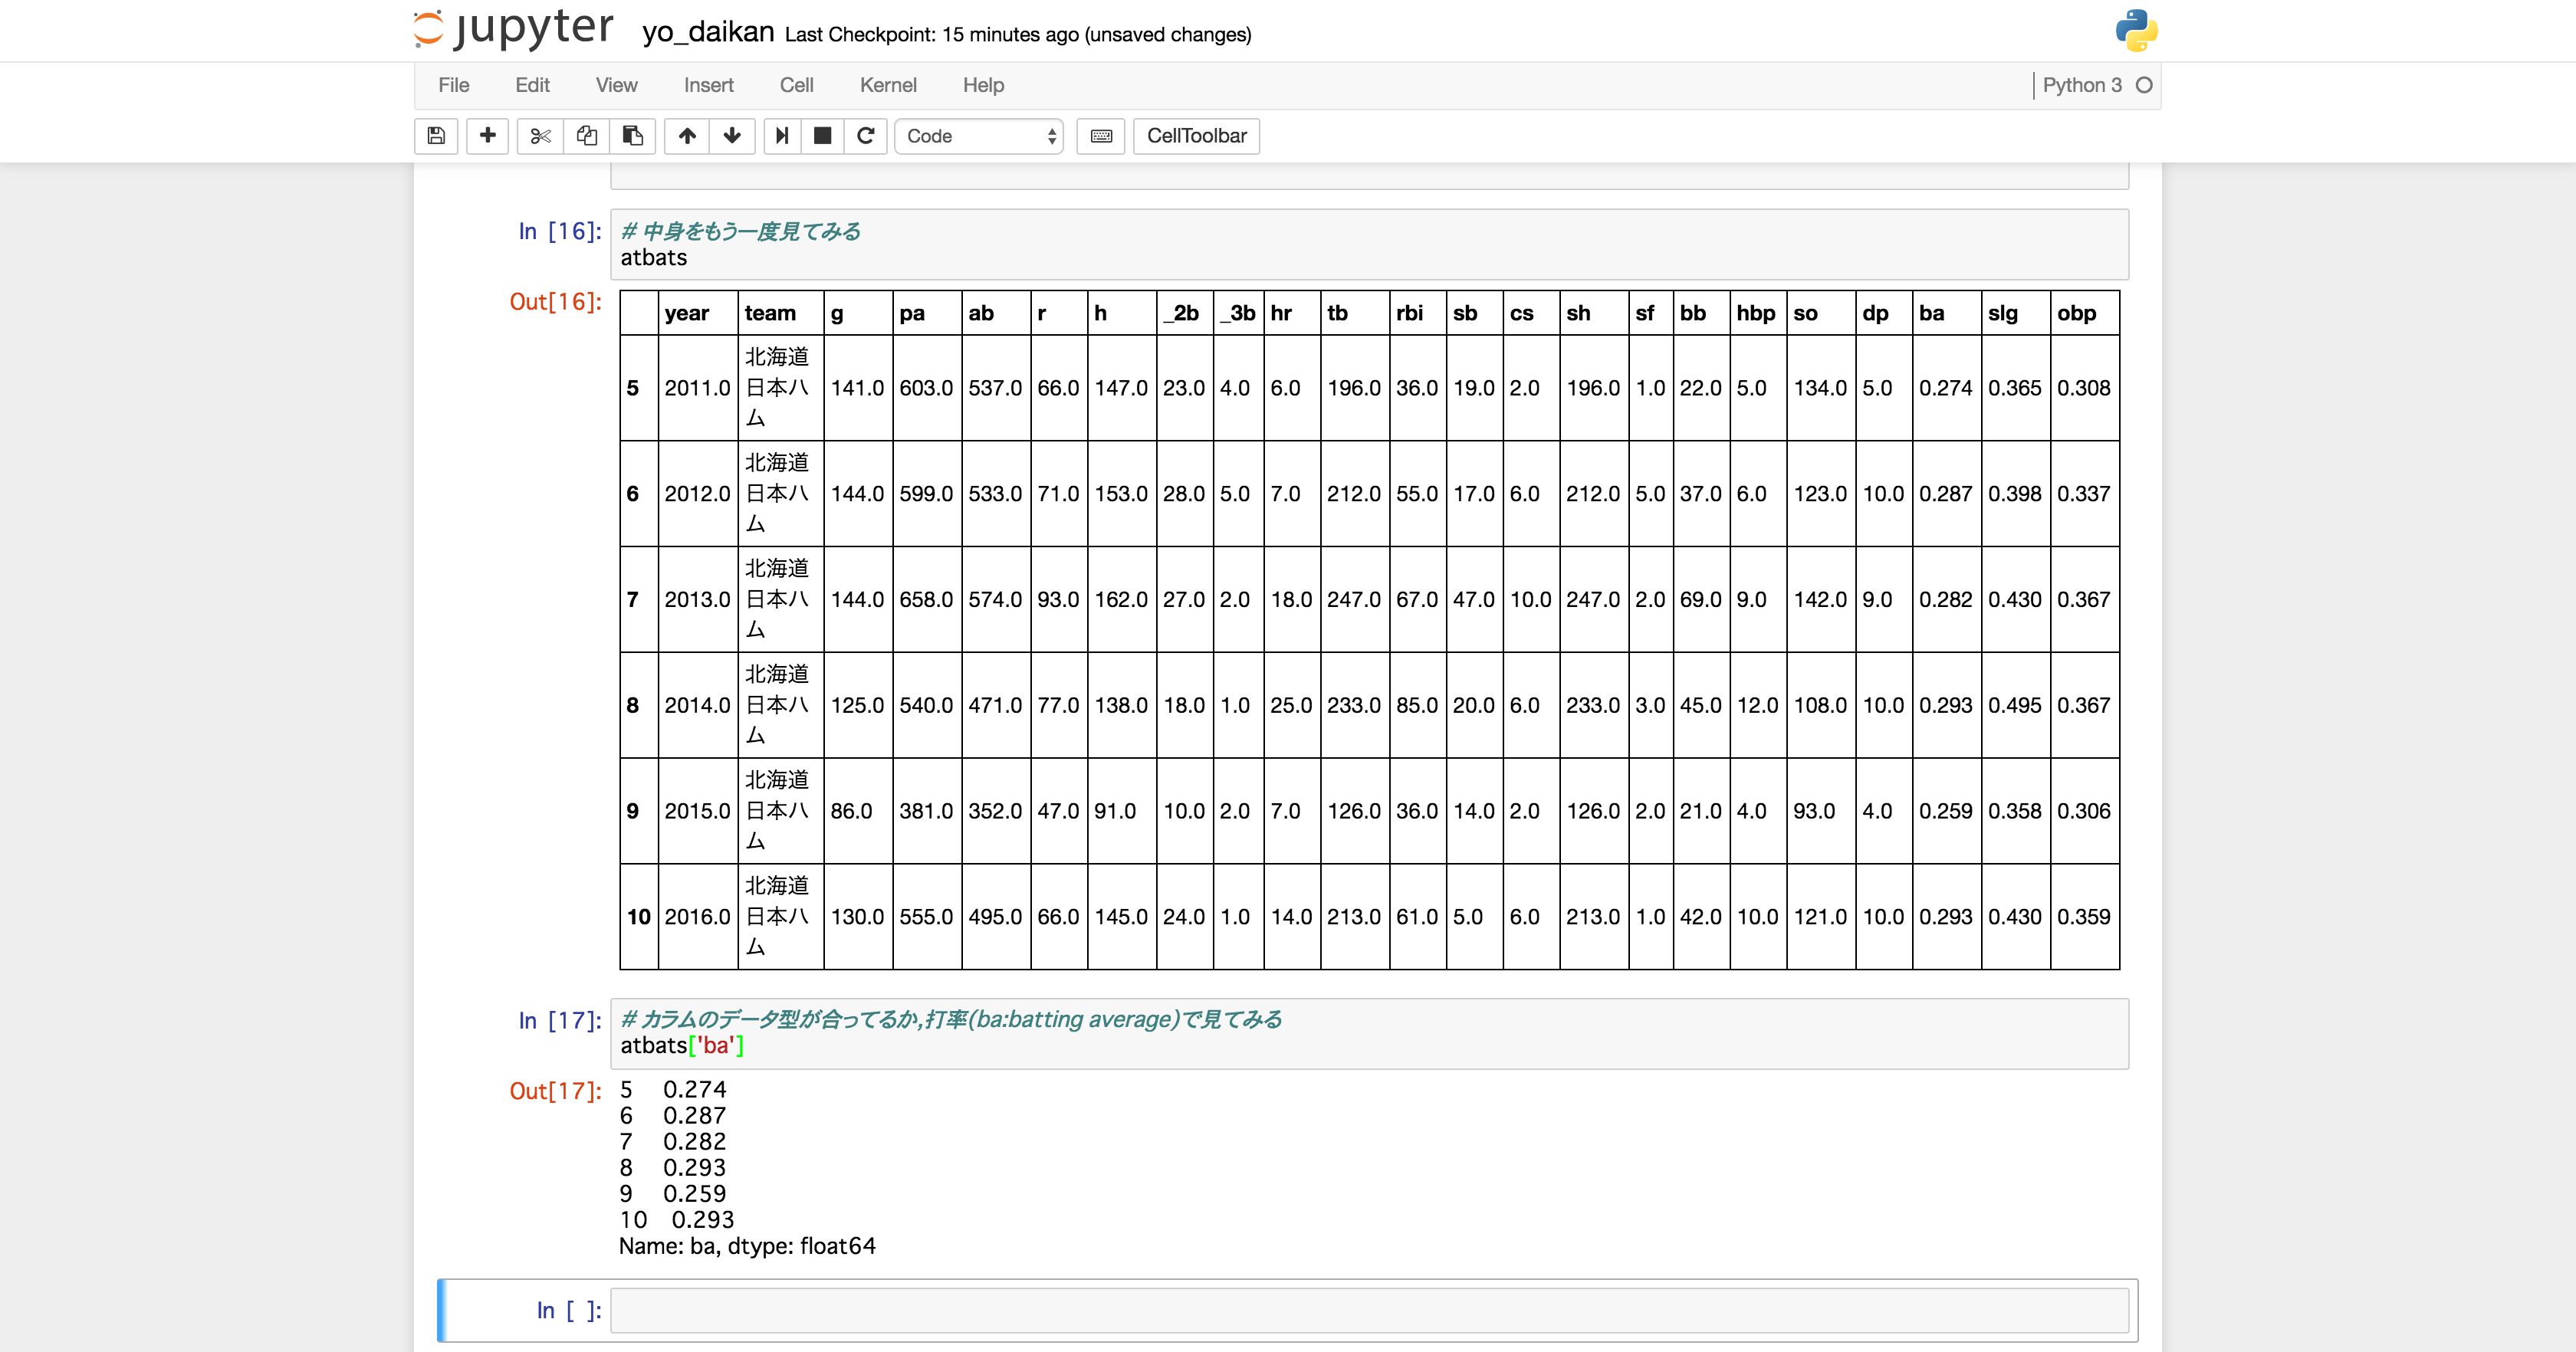
If you say the answer first, index = 3 (4th line) is the batting score.
Maybe this will happen.

Preprocessing
Select the required Table from multiple Tables on the page & clean the data type etc. for easy subsequent processing.
#Discard garbage data and move to another data frame(index and,Results before 2010&total)
atbats = df[3].drop([0, 1, 2, 3,4, 11])
Also, since the column of this data is index (actual Japanese column is treated as data), re-add the column.
Japanese is OK, but I personally recommend the abbreviation for baseball English (I think it's familiar to those who are watching MLB).
Also, since the data type is also an ordinary object (it does not change the data type like read_csv), I will specify the type properly.
#Give a column name(Baseball English abbreviation)
atbats.columns = ['year', 'team', 'g', 'pa', 'ab', 'r', 'h', '_2b', '_3b', 'hr', 'tb', 'rbi', 'sb', 'cs', 'sh', 'sf', 'bb', 'hbp', 'so', 'dp', 'ba', 'slg', 'obp']

#Preprocess each column
import numpy as np
atbats['year'] = atbats['year'].fillna(0).astype(np.float64)
atbats['g'] = atbats['g'].fillna(0).astype(np.float64)
atbats['pa'] = atbats['pa'].fillna(0).astype(np.float64)
atbats['ab'] = atbats['ab'].fillna(0).astype(np.float64)
atbats['r'] = atbats['r'].fillna(0).astype(np.float64)
atbats['h'] = atbats['h'].fillna(0).astype(np.float64)
atbats['_2b'] = atbats['_2b'].fillna(0).astype(np.float64)
atbats['_3b'] = atbats['_3b'].fillna(0).astype(np.float64)
atbats['hr'] = atbats['hr'].fillna(0).astype(np.float64)
atbats['tb'] = atbats['tb'].fillna(0).astype(np.float64)
atbats['rbi'] = atbats['rbi'].fillna(0).astype(np.float64)
atbats['sb'] = atbats['sb'].fillna(0).astype(np.float64)
atbats['cs'] = atbats['cs'].fillna(0).astype(np.float64)
atbats['sh'] = atbats['tb'].fillna(0).astype(np.float64)
atbats['sf'] = atbats['sf'].fillna(0).astype(np.float64)
atbats['bb'] = atbats['bb'].fillna(0).astype(np.float64)
atbats['hbp'] = atbats['hbp'].fillna(0).astype(np.float64)
atbats['so'] = atbats['so'].fillna(0).astype(np.float64)
atbats['dp'] = atbats['dp'].fillna(0).astype(np.float64)
atbats['ba'] = atbats['ba'].fillna(0).astype(np.float64)
atbats['slg'] = atbats['slg'].fillna(0).astype(np.float64)
atbats['obp'] = atbats['obp'].fillna(0).astype(np.float64)
If you can bring it to this state, it's time for fun visualization and index calculation.
Analysis time!
First, let's graph the index
Here we use seaborn.
Let's see the transition of batting average from 2011 to 2016.
#Draw a graph(at seaborn)
import seaborn as sns

#batting average(ba, batting average)To a line graph
sns.pointplot(x="year", y="ba", data=atbats)
I'm sure you will see a graph like this.

You can see that the numbers for 2015 have dropped.
This year has been the year of the worst performance due to injuries during the season, in addition to the injured shoulders and thighs since 2014 (from my memory & Wikipedia).
There are some other data, so if you are interested, please make a graph and play with it.
In addition, it is good to check the official website for how to use seaborn.
seaborn official documentation
Finally, to the world of Sabermetrics! !! !!
This time I will challenge with a simple index.
OPS(On the base Plus Slugging) Grasp the rough attack power by adding the on-base percentage + slugging percentage, the ability to not go out (on-base percentage) and the ability to advance to base (slugging percentage)
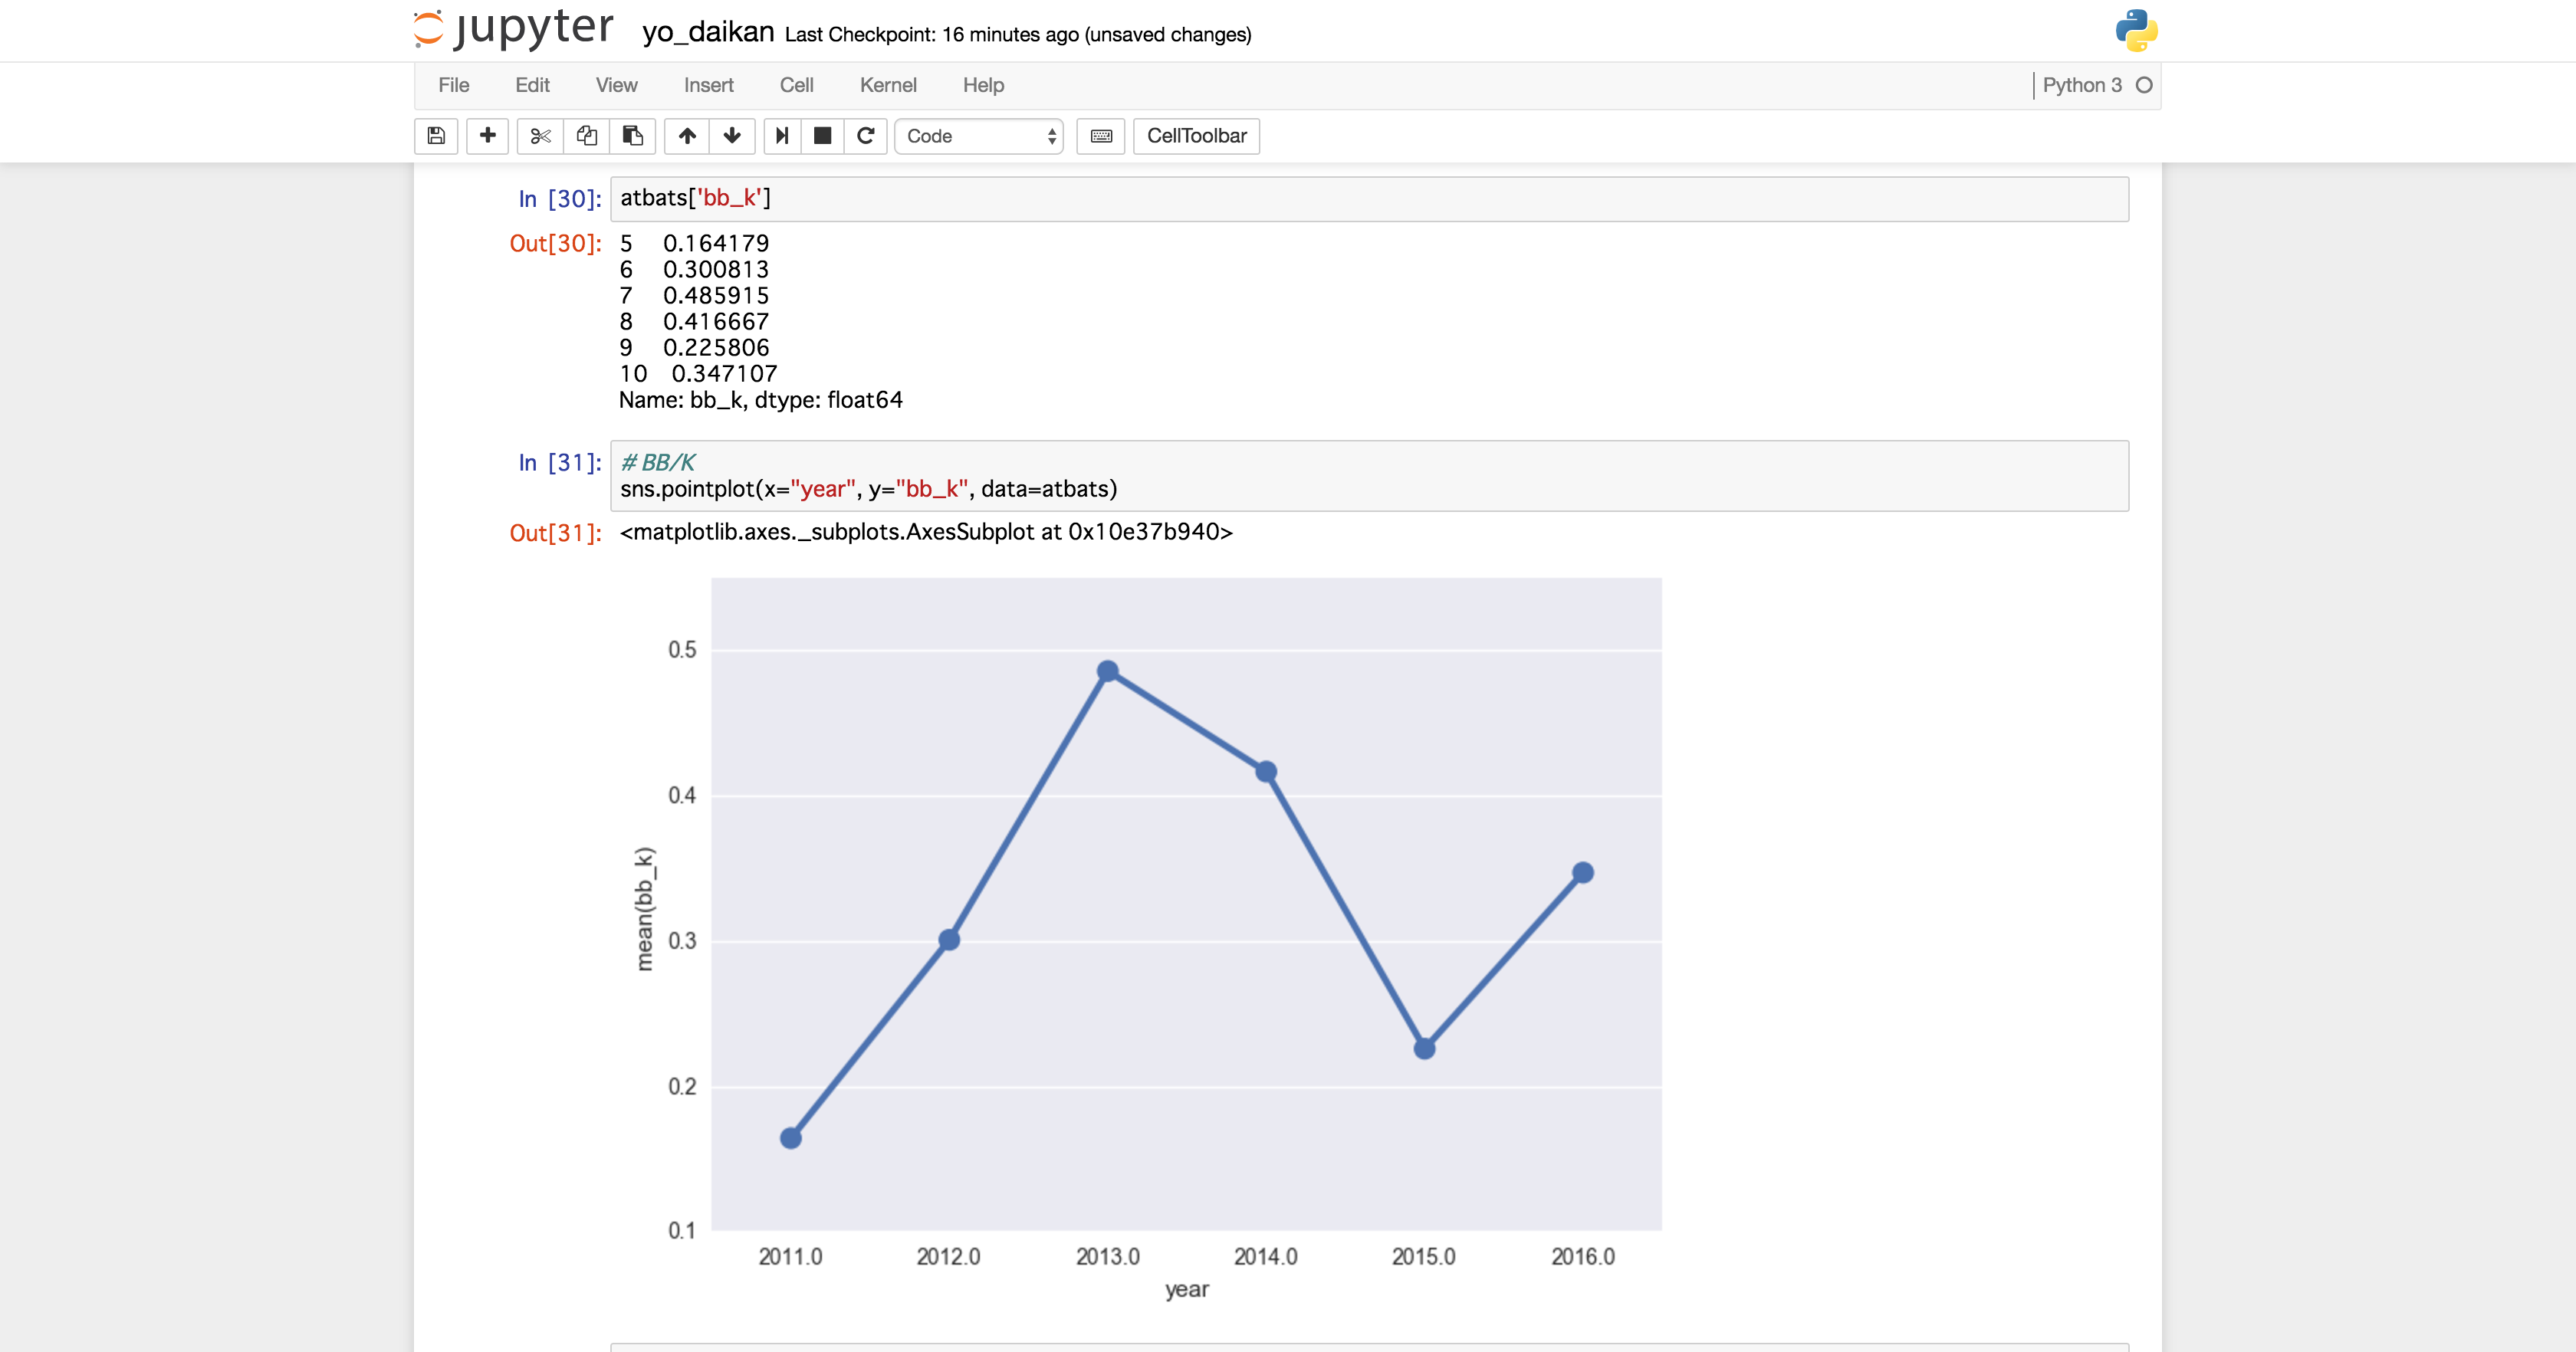
BB/K(Base on Balls per Strike out)
- Walks / strikeouts
- How many walks are selected for each strikeout
- A barometer of patience in batting eye and at bat (preferably around 1; ideally 1.5-2).
code
It can be done by four arithmetic operations between data frames.
#OPS and BB/Calculate K

atbats['ops'] = atbats['obp'] + atbats['slg'] # OPS
atbats['bb_k'] = atbats['bb'] / atbats['so'] # BB/K
Click here for the results!
OPS

BB/K
Consideration
- Originally, the lead-off (most batter) type Yo-sama's OPS is a fair passing score (ideally about .750 to .800)
- Just don't let me clean up
- It would be the strongest if we could maintain the numbers for 2014, but I'm worried that the numbers will be wrong due to the breakdown in 2015 (although 2016 is back)
- ** BB / K numbers are not good **
- Possibility of being a fan even though he is the best batter
Re-challenge! ~ How many strikeouts each time you choose one walk
There is also K / BB, which is the opposite of BB / K, so let's take a look there as well.
- Originally an index for evaluating pitchers (number of strikeouts per walk)

** You can see that this year's Dai-Kang Yang struck out about three per walk. **
If K / BB doesn't fit in 1.5-2.0, if not as bad as 6.09 in 2011 and 4.42 in 2015,
** No. 1 batter type in terms of OPS, but there are more strikeouts than bases
It seems to be a painful feeling.
The Hokkaido Nippon-Ham Fighters are a team that looks at the data in considerable detail (although it is a mystery to recommend a sacrifice bunt), and it seems possible that the deterioration of the numbers in this area led to FA (actually more detailed numbers & here). The defense that cannot be expressed is also affected).
Summary (3 minutes 4 seconds)
This code snippet (1 minute)
Here is a summary of the snippets I wrote in pieces.
Let's Sabermetrics of Dai-Kang Yang
Impressions & what I want to say (2 minutes)
In a Python (or PyData) sense
Mainly what I want to say Main (experienced)
- ** You can do machine learning suddenly, but I think it's a good idea to start with familiar themes and learn the library and manners! ** **
- You can be good at what you like
- Suddenly trial and error is difficult at work, so if you do it with a theme you are familiar with, you will be happy.
- Data acquisition is as soon as you get the hang of it, but preprocessing is still difficult.
- There are many steady tasks such as data typing and confirmation calculation, even if it is just scraped from HP.
- ** Don't think you can use the fetched data right away! ** **
- ** Any means, but environment virtualization is essential! ** **
- venv, virtualenv Anything is fine, so the execution environment should be virtualized
- For some reason, when I manipulate the data, the library I want to use comes out.
- This article also looks easy and I'm just trying and error
- Personally, it doesn't matter if it's venv or virtualenv, but you should be able to master what you think "this is it!"!
- Even if I was told "My environment suddenly stopped working!" ...
- I dared to make a preface like "What is a virtual environment!"
In a baseball (or Sabermetrics) sense
- ** It's fun to calculate and consider indicators! ** **
- Python or Excel can be anything, so if you try it yourself, you will find many discoveries.
- Is the media or commentary properly spoken below? ← Example of discovery
- You can crush it all day with just the data, so if you like it, please try it.
- About Dai-Kang Yang
- First of all, I want you to heal your body properly
- After all, I feel that the peak as a player has dropped since the injury in 2014.
- The lead-off is unfortunate (although it has a long hitting power) because there are many strikeouts and you cannot expect to reach the base.
- Which team suits you! ??
- Hmm ...
- I want to analyze this a little more
One last word (4 seconds)
** Why isn't it related to Hanshin! ** **
... tomorrow, kimihiro_n, thank you!
[Bonus] Reference book (baseball)
For those who want to learn more about Sabermetrics.
- Money Ball
- Winning Baseball Statistics Sabermetrics
- Big data baseball, the magic of mathematics that revived the Pittsburgh Pirates, the 20th consecutive losing team
I wonder if there is no doubt if this area is suppressed!
Recommended Posts