[Python scipy] Upscale / downscale 2D data
Vocabulary Book. Reprinting a lot because it is troublesome to search every time. There is an original URL.
Sometimes it gets confusing:
--Upscale: Coarse resolution --Downscale: Finer resolution
Value interpolation is summarized here: [SciPy.org: Interpolation (scipy.interpolate)] (https://docs.scipy.org/doc/scipy-0.14.0/reference/interpolate.html)
Of these, the one that is often used for upscale / downscale
- interp2d
--Two-dimensional only.
kind= ‘linear’, ‘cubic’, ‘quintic’
- RegularGridInterpolator
--Can be used in other than 2D
-Must be "regular grid" (not necessarily evenly spaced)
method= 'linear', 'nearest' --Faster than ʻintrep2d` if this is fine
Example using RegularGridInterpolator
[stackoverflow: Scipy interpolation with masked data?] (https://stackoverflow.com/questions/35807321/scipy-interpolation-with-masked-data) Is easy to understand. In the case of MaskedArray, it is faster to convert the mask itself (rather than filling the masked part with np.nan).
import numpy as np
from scipy import interpolate

def conv_resol(arr, newshape, *args, **kwargs):
    '''
    Args:
        arr [2d ndarray or MaskedArray]
        newshape [tuple of int]
        *args, **kwargs: for interpolate.RegularGridInterpolator
    '''
    nx0, ny0 = arr.shape
    nx1, ny1 = newshape
    x0 = np.linspace(0, 1, nx0)
    y0 = np.linspace(0, 1, ny0)
    x1 = np.linspace(0, 1, nx1)
    y1 = np.linspace(0, 1, ny1)
    x1, y1 = np.meshgrid(x1, y1) # x1 [ny1,nx1], y1 [ny1, nx1]
    xy1 = np.array((x1, y1)).T   # xy1 [nx1, ny1, 2]
    arr1 = interpolate.RegularGridInterpolator((x0, y0), arr, *args, **kwargs)(xy1)
    if isinstance(arr, np.ma.MaskedArray):
        mask1 = interpolate.RegularGridInterpolator((x0, y0), arr.mask.astype('float'), *args, **kwargs)(xy1) > 0.0
        return np.ma.masked_array(arr1, mask=mask1)
    return arr1
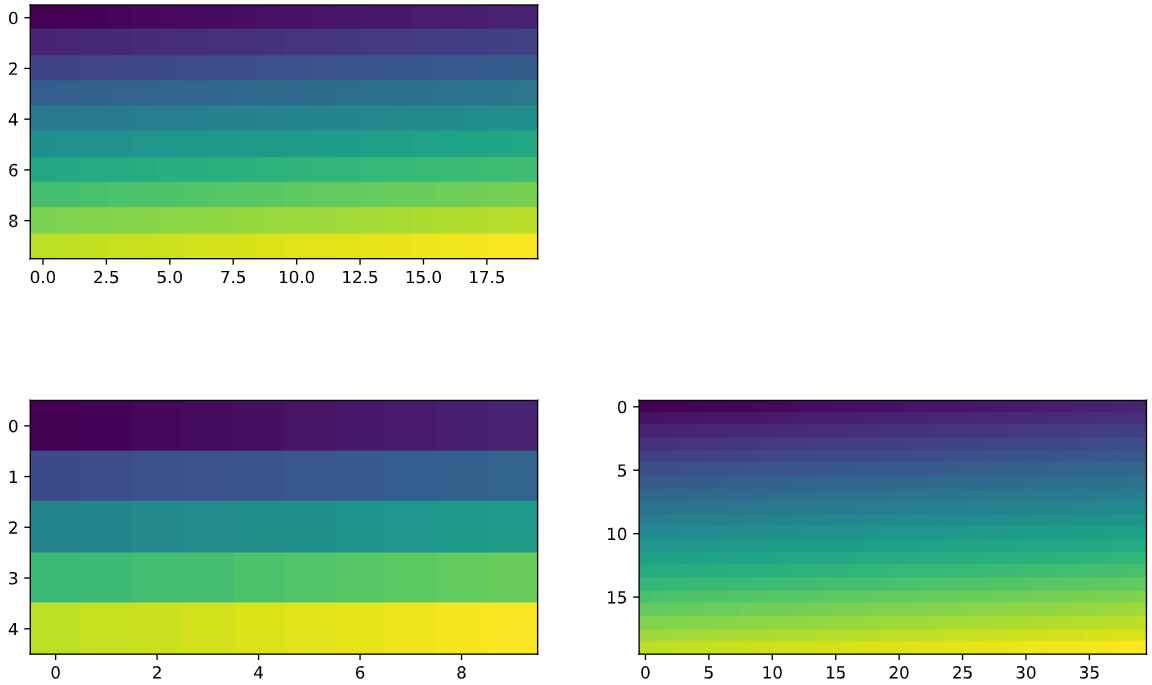
test
import matplotlib.pyplot as plt


nx0, ny0 = 10, 20
arr0 = np.arange(nx0 * ny0).reshape(nx0, ny0) * (1.0 / (nx0 * ny0))

nx1, ny1 = 5, 10
arr1 = conv_resol(arr0, (nx1, ny1))

nx2, ny2 = 20, 40
arr2 = conv_resol(arr0, (nx2, ny2))

plt.figure(figsize=(12,8))
plt.subplot(2,2,1)
plt.imshow(arr0, vmin=0.0, vmax=1.0)
plt.subplot(2,2,3)
plt.imshow(arr1, vmin=0.0, vmax=1.0)
plt.subplot(2,2,4)
plt.imshow(arr2, vmin=0.0, vmax=1.0)
Recommended Posts