[PYTHON] Output networkX graph with graphviz (PyGraphviz)
Installation
I wanted to move from drawing using matplotlib.pyplot to grahviz, so I tried various things.
I found a useful thing called PyGraphviz. Install by referring to the official (http://pygraphviz.github.io/documentation/pygraphviz-1.3rc1/install.html#quick-install).
I have pip in it, so
% pip install pygraphviz
It ends with.
I wrote it
pgvSample.py
import pygraphviz as pgv
import networkx as nx

#Create networkx graphs normally
h = nx.newman_watts_strogatz_graph(10,3,0.4)

#Convert this to agraph class (PyGraphviz)
g = nx.to_agraph(h)

#file.Output with the name pdf, use circo for layout
g.draw('file.pdf',prog='circo')
(Addition) The conversion method has been changed to another module from Networkx 1.11. http://networkx.readthedocs.io/en/networkx-1.11/reference/drawing.html
g = nx.nx_agraph.to_agraph(h)
Run
When these 5 lines are executed, file.pdf is created.
% python pgvSample.py % ls file.pdf pgvSample.py % open file.pdf
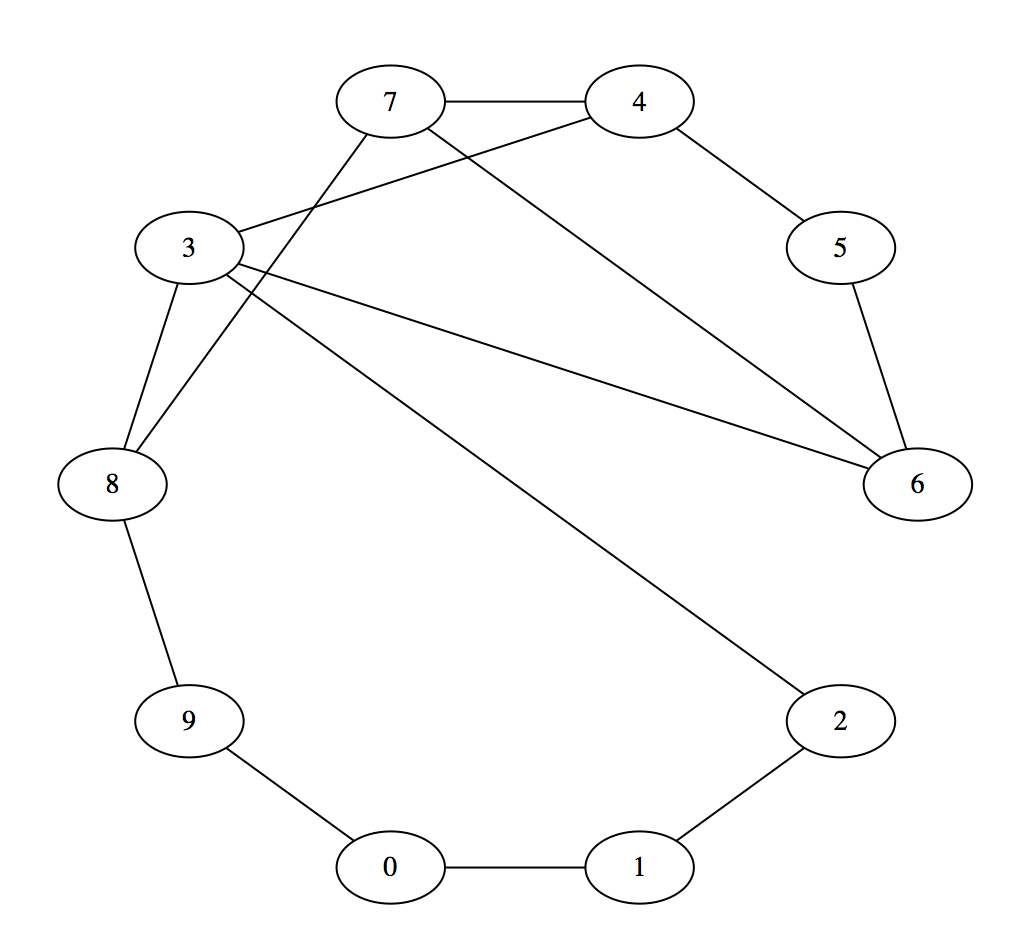
When I open it, it looks like this.
Layout
As for the layout of the graph, there are various options when looking at the documentation.
prog=[’neato’|’dot’|’twopi’|’circo’|’fdp’|’nop’]
What each of them is is summarized on this site (http://melborne.github.io/2013/04/02/graphviz-layouts/).
Create a .dot file
Just add this one line to the above program and you can save it as a dot file.
pgvSample.py
g.write("file.dot")
Like this.
% cat file.dot strict graph "newman_watts_strogatz_graph(10,3,0.4)" { 0 -- 1; 0 -- 6; 0 -- 9; 1 -- 2; 1 -- 5; 2 -- 3; 2 -- 5; 2 -- 8; 3 -- 4; 3 -- 9; 4 -- 5; 4 -- 8; 5 -- 6; 6 -- 7; 7 -- 8; 8 -- 9; }
The AGraph class can also read a .dot file and create a graph, so it may be convenient if you want to use the same graph on another occasion. (Reference: ** Tutorial ** http://networkx.lanl.gov/pygraphviz/tutorial.html)
Other references
It seems that various cooperation with networkX is possible.
** Graphviz AGraph (dot) ** item http://networkx.lanl.gov/reference/drawing.html
Recommended Posts