[PYTHON] Data cleaning How to handle missing and outliers
I will write about the handling of outliers and missing values in data cleaning. Think of it as running on Jupyter.
Data preparation
First of all, data preparation You can easily create data by using scikit-learn's make_classification function, so prepare it.
Reference: http://overlap.hatenablog.jp/entry/2015/10/08/022246
Now let's read the data.
import numpy as np
import pandas as pd
import matplotlib.pyplot as plt
import seaborn as sns

%matplotlib inline

data = pd.read_csv('2d_data.csv', header = None)
The data prepared this time looks like this
data = data.as_matrix()
data

#output

array([[  1.00000000e+00,  -7.42847611e+00,   1.50990301e+00],
       [  0.00000000e+00,   2.98069292e+00,   1.96082119e+00],
       [  0.00000000e+00,   3.98825476e+00,   4.63638899e+00],
       [  1.00000000e+00,  -5.78943741e+00,  -4.62161424e+00],
       [  1.00000000e+00,  -4.89444674e+02,  -3.26972997e+02],
       [  1.00000000e+00,  -1.93394930e+00,  -4.72763616e-02],
       [  0.00000000e+00,  -1.61177146e+00,   5.93220121e+00],
       [  1.00000000e+00,  -6.67015188e+00,              nan],
       [  1.00000000e+00,  -2.93141529e+00,  -1.04474622e-01],
       [  0.00000000e+00,  -7.47618437e-02,   1.07000182e+00],
       [  1.00000000e+00,  -2.69179269e+00,   4.16877367e+00],
       [  0.00000000e+00,              nan,   3.45343849e+00],
       [  0.00000000e+00,  -1.35413500e+00,   3.75165665e+00],
       [  1.00000000e+00,  -6.22947550e+00,  -1.20943430e+00],
       [  0.00000000e+00,   2.77859414e+00,   7.58210258e+00],
       [  1.00000000e+00,  -5.71957792e+00,  -2.43509341e-01],
       [  0.00000000e+00,   9.28321714e-01,   3.20852039e+02],
       [  0.00000000e+00,   8.50475089e+01,   2.90895510e+00],
       [  1.00000000e+00,  -6.02948927e+00,  -1.83119942e+00],
       [  0.00000000e+00,   1.11602534e+00,   3.35360162e+00]])
You can see outliers and missing values (Nan). Let's divide it into x and y data.
X = data[:,1:3]
y = data[:,0].astype(int)
X.shape, y.shape

#output
((20, 2), (20,))
Now let's plot the first and second columns of the X data.
plt.scatter(X[:, 0], X[:, 1], c=y, s=50, cmap='Blues');
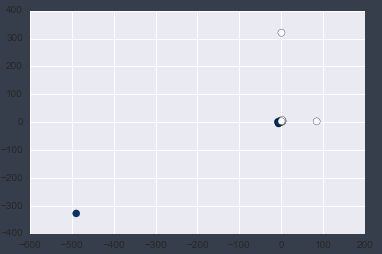
You can clearly see the outliers by plotting.
How to fill in missing values
You can check Nan by using np.isnan (). If there is a missing value, it will return True.
np.isnan(X[:, 0]),np.isnan(X[:, 1])

#output

(array([False, False, False, False, False, False, False, False, False,
        False, False,  True, False, False, False, False, False, False,
        False, False], dtype=bool),
 array([False, False, False, False, False, False, False,  True, False,
        False, False, False, False, False, False, False, False, False,
        False, False], dtype=bool))
Now, let's make X1 and'y1'excluding missing values.
X1 = X[~np.isnan(X[:, 1]) & ~np.isnan(X[:, 0])]
y1 = y[~np.isnan(X[:, 1]) & ~np.isnan(X[:, 0])]

X1, y1
#output

Out[139]:
(array([[ -7.42847611e+00,   1.50990301e+00],
        [  2.98069292e+00,   1.96082119e+00],
        [  3.98825476e+00,   4.63638899e+00],
        [ -5.78943741e+00,  -4.62161424e+00],
        [ -4.89444674e+02,  -3.26972997e+02],
        [ -1.93394930e+00,  -4.72763616e-02],
        [ -1.61177146e+00,   5.93220121e+00],
        [ -2.93141529e+00,  -1.04474622e-01],
        [ -7.47618437e-02,   1.07000182e+00],
        [ -2.69179269e+00,   4.16877367e+00],
        [ -1.35413500e+00,   3.75165665e+00],
        [ -6.22947550e+00,  -1.20943430e+00],
        [  2.77859414e+00,   7.58210258e+00],
        [ -5.71957792e+00,  -2.43509341e-01],
        [  9.28321714e-01,   3.20852039e+02],
        [  8.50475089e+01,   2.90895510e+00],
        [ -6.02948927e+00,  -1.83119942e+00],
        [  1.11602534e+00,   3.35360162e+00]]),
 array([1, 0, 0, 1, 1, 1, 0, 1, 0, 1, 0, 1, 0, 1, 0, 0, 1, 0]))
How to remove outliers
X2 = X1[(abs(X1[:, 0] < 10)) & (abs(X1[:, 1]) < 10)]
y2 = y1[(abs(X1[:, 0] < 10)) & (abs(X1[:, 1]) < 10)]
If you write it like this, it will return a number of 10 or more as follows.
(array([ True,  True,  True,  True,  True,  True,  True,  True,  True,
         True,  True,  True,  True,  True,  True, False,  True,  True], dtype=bool),
 array([ True,  True,  True,  True, False,  True,  True,  True,  True,
         True,  True,  True,  True,  True, False,  True,  True,  True], dtype=bool))
Now let's remove the outliers.
X2 = X1[(abs(X1[:, 0] < 10)) & (abs(X1[:, 1]) < 10)]
y2 = y1[(abs(X1[:, 0] < 10)) & (abs(X1[:, 1]) < 10)]
Let's plot it.
plt.scatter(X2[:, 0], X2[:, 1],c = y2, s=50, cmap='Blues');
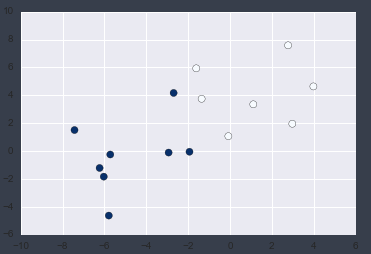
I was able to confirm that there were no outliers!
Recommended Posts