[PYTHON] How to deal with imbalanced data
This is the article on the 10th day of the DoCoMo Advanced Technology Research Institute Advent Calendar.
My name is Kaneda from DoCoMo. In this article, we will explain the basics of evaluation methods and model building methods for imbalanced data that are often encountered in actual data analysis. Also, in the second half of the article, we are conducting experiments to deepen our understanding of imbalanced data. I think there are many points that cannot be reached, but thank you.
1. What is imbalanced data?
Data such as ** 1% for positive cases and 99% for negative cases **. Not limited to binary classification, it may be handled in multi-class classification. This article focuses on the most common binary classifications (where there are positive and negative minority cases).
2. Evaluation method
The key to building a model from imbalanced data is deciding how to evaluate the model. If the evaluation method is not decided, the goal to be aimed at will not be known. In the case of unbalanced data, it should be noted that there are evaluation indicators that cannot be interpreted in the same way as usual.
How to evaluate
In conclusion, I think it is better to ** draw a Precision-Recall curve (hereinafter referred to as PR curve) **. On top of that, it is important to consider the balance between Precision and Recall required for each problem setting, set an appropriate threshold value, and perform final binary classification. When tuning the parameters of the model, it is recommended to use the area under the PR curve (hereinafter referred to as PR-AUC) as an evaluation index.
In the following, we will explain why PR curves and PR-AUC should be used in predicting imbalanced data.
Correct and incorrect answers in binary classification
| Positive | Negative | |
|---|---|---|
| Positive | TP: True Positive | FN:False Negative |
| Negative (true value) | FP: False Positive | TN: True Negative |
This table is called a mixed matrix and is indispensable for considering the evaluation index of binary classification. Since it is correct to predict that a positive example is a positive example and a negative example is a negative example, a model with many TPs and TNs and few FNs and FPs is a good model.
At this time, consider whether to prioritize reducing the false predictions of FN and FP. In general, when predicting imbalanced data, do you often prioritize reducing FN? The reason for this is that, as long as the minority's positive case is misjudged, even if the majority's negative case is slightly misjudged as a positive case, it is often desired to reliably judge the positive case as a positive case. This is because (of course it depends on the problem setting). ** In the problem setting that I face now, it is important to be aware of whether FN or FP should be prioritized in the final binary classification. ** **
Typical evaluation index
Based on the above, let's look at typical evaluation indexes in binary classification.
Accuracy = (TP+TN)/(TP+FP+TN+FN)
Accuracy is the most obvious indicator, but it is difficult to use in predicting imbalanced data. This is because the Accuracy can easily be close to the maximum value of 1 simply by building a model that predicts that all are negative examples of the majority. It is clear that such a model is not the one you are looking for, so it would be inappropriate to use Accuracy as a metric.
Precision = TP/(TP+FP)\\
Recall = TP/(TP+FN)
Next are Precision and Recall. These are generally considered to be in a trade-off relationship, and when Precision is high / low, Recall is low / high. Now, let's think about FN and FP again to consider which one should be prioritized. Earlier, I explained that you often want to reduce FN when predicting imbalanced data, but in that case you should aim to increase the recall that includes FN in the denominator. However, if you just want to set Recall to the maximum value of 1, you can build a model that predicts that all are positive examples of the minority, contrary to the example of Accuracy. ** Therefore, it is not necessary to use either Precision or Recall as the evaluation index, but it is necessary to comprehensively evaluate the model from the two evaluation indexes. ** **
However, there are many times when you want to combine the two metrics Precision and Recall into one. The evaluation index that is often used at that time is the F1 value introduced below.
F-measure = 2Recall*Precision/(Recall+Precision)
The F1 value is calculated from the harmonic mean of Precision and Recall. Intuitively, a model with a high F1 value will have a high Precision and Recall. Please note that the F1 value evaluates Precison and Recall equally, and is not an index that prioritizes either Precision or Recall [^ 1].
About threshold
Before proceeding to the introduction of the next evaluation index, I will explain the concept of thresholds in binary classification. When predicting whether the model is positive or negative, a score such as "80% probability of being positive" is first calculated, and if the score is higher than the threshold (for example, 50%), it is positive, and if it is lower, it is negative. Deemed processing is performed. Since the prediction result changes greatly by changing this threshold value, it is necessary to decide which threshold value should be used when actually performing binary classification.
The four types of evaluation indexes introduced earlier are all indexes calculated after determining the threshold value. Therefore, if it is decided in advance that "50% is the threshold value", I think that the model may be constructed so that the F1 value calculated when the threshold value is 50% is the highest. However, there are many cases where ** it is only necessary to properly classify by one of the thresholds (the threshold is not set to a specific value) **, and in that case, an evaluation index that does not require a threshold will be used.
Evaluation index that does not require a threshold
The area under the ROC curve (ROC-AUC) and the area under the PR curve (PR-AUC) are evaluation indexes that do not require a threshold.
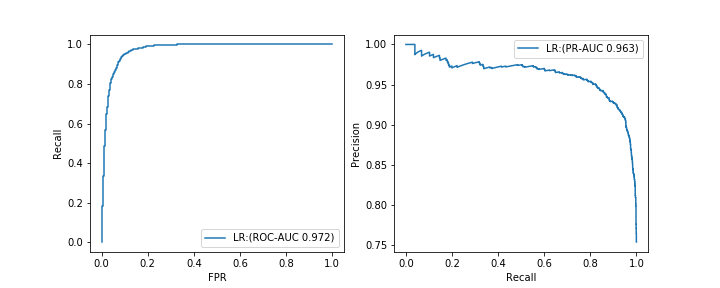
--ROC-AUC: Area under the curve drawn when plotting the relationship between Recall and false positive rate FPR while changing the threshold (left figure) --PR-AUC: Area under the curve drawn when plotting the relationship between Precision and Recall while changing the threshold (right figure)
The formula for calculating the false positive rate FPR is as follows.
FPR = FP/(FP+TN)
I think that AUC often refers to ROC-AUC. I will omit the detailed explanation, but all the indicators have similar basic properties, and the closer to the maximum value of 1, the better the model. Also, since both are calculated based on two evaluation indexes like the F1 value, we usually do not consider a meaningless model that predicts all as positive or negative examples as good. However, in the case of ** imbalanced data forecasting, ROC-AUC may not be a good metric. ** **
It is difficult to explain the reason accurately, but as an easy-to-understand understanding of myself, ** ROC-AUC evaluates "Is it possible to correctly predict positive examples as positive examples and negative examples as negative examples?" On the other hand, PR-AUC only considers "whether the correct example can be correctly predicted as the correct example" as the evaluation point. ** When predicting imbalanced data, it is easy to predict the majority of negative cases as negative cases, and ROC-AUC, which uses this as an evaluation point, ** most of the positive cases are positive cases. Even if it is not predictable, ** just building a model that predicts the majority of negative cases as negative cases will result in higher final values. On the other hand, PR-AUC uses only whether a positive example can be predicted as a positive example as an evaluation point, so no matter how correctly a negative example is predicted as a negative example, it will not be evaluated at all.
However, it does not mean that PR-AUC is superior to ROC-AUC. ** In predicting imbalanced data, it is important to properly predict minority positive cases (I think that it is often the case). Therefore, **, PR-AUC is considered to be an appropriate evaluation index.
Actually, when there was a model A with a PR-AUC of 0.5 and a model B with a PR-AUC of 0.4, "The overall performance seen with the PR-AUC is better for the model A, but a specific recall. At that time, the Precision of model B is higher. ”So ** Do not stick to one value of AUC so much, consider the required balance of Precision and Recall, draw a PR curve and final I think it is good to check the quality of the typical model. ** **
3. How to build a model
In the following, we will introduce general countermeasures for imbalanced data. In this article, I will briefly introduce only the outline.
Processing on data
The easiest way is to reduce the majority data (undersampling) or increase the minority data (oversampling). It is also possible to combine these two. When undersampling, there is a method using clustering to prevent sampling bias. Also, when oversampling, an algorithm called SMOTE is famous.
If you adjust the data by sampling, the output score value will be distorted, so if the score value itself is important, you will need to correct the value [^ 2]. If the score value itself is not important and it is important to divide it into positive and negative cases, then no correction is necessary.
Processing for the algorithm
When training the model, we internally solve the objective function minimization problem. At this time, by adjusting the penalty for misjudging the negative case of the majority and the penalty for misjudging the positive case of the minority, it is possible to correctly predict the positive case of the minority. ..
Supplement: Utilization of ensemble learning
When reducing the majority of negative data by undersampling, it is expected that the tendency of the negative data will change depending on how it is reduced. There are many ways to keep the data trend unchanged, but it is said that a method that combines ensemble learning is a good way to deal with it [^ 3].
Supplement: Anomaly detection
If there is too much difference in the number of data between the positive and negative examples, it is possible to consider the minority positive examples as abnormal and then apply the anomaly detection algorithm (this article omits them). ..
4. Experiment
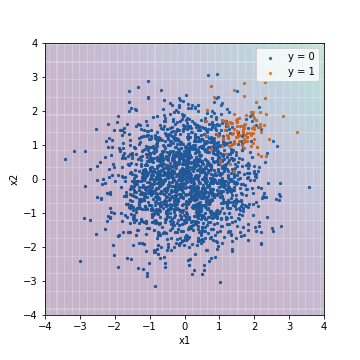
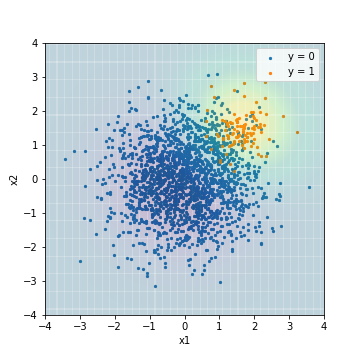
Experiment to better understand the imbalanced data. In this experiment, imbalanced data is created from random numbers that follow a normal distribution and evaluated using various models. The amount of data is 500 for positive cases (y = 1) and 10000 for negative cases (y = 0). The features are two-dimensional to emphasize the ease of visualization.

As a minimum experimental condition, the training data and the test data are separated by 8: 2, and the test data is predicted after simple parameter tuning. In this experiment, for comparison, the result of tuning based on the F1 value and the result of tuning based on PR-ROC [^ 4] are described respectively.
#When tuning with the f1 value
GridSearchCV(model, params, scoring="f1")
# PR-When tuning with AUC
GridSearchCV(model, params, scoring="average_precision")
When splitting a dataset, try to split it while maintaining the balance between positive and negative examples [^ 5].
# scikit-learn train_test_When using the split function
X_train, X_test, y_train, y_test = train_test_split(X, y, test_size=0.2, stratify=y)
Logistic regression
No action
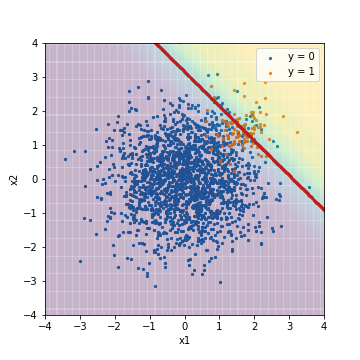
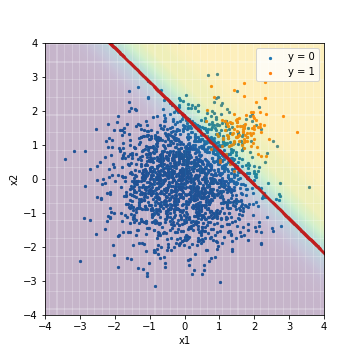
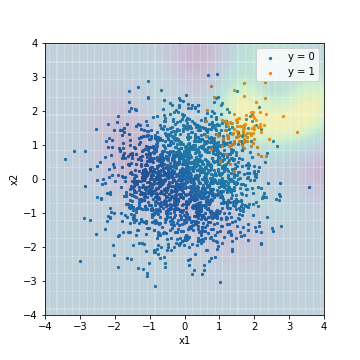
The first is the prediction result of normal logistic regression without any special ingenuity.
--Tuning with F1 value
| Accuacy | Precision | Recall | F1 | ROC-AUC | PR-AUC | |
|---|---|---|---|---|---|---|
| LR@F1 | 0.960 | 0.642 | 0.430 | 0.515 | 0.975 | 0.632 |
The background color indicates the score value, with yellow indicating a positive example and purple indicating a negative example. The red line is the threshold value, and the Accuracy, Precision, Recall, and F1 values are calculated from the results of classification based on this threshold value. The result, as expected, was dragged by the negative of the majority.
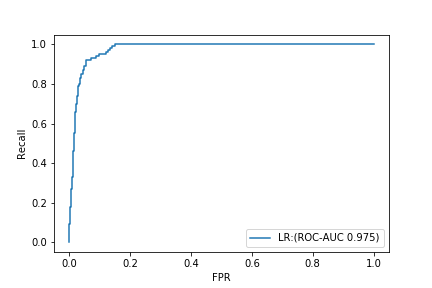
ROC-AUC has an amazing value of 0.975.
On the other hand, PR-AUC is 0.632.
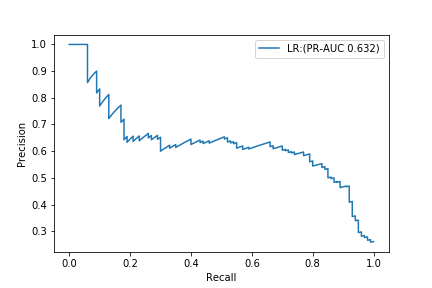
If you look only at ROC-AUC, you may think that you have made a terrifyingly good model, but if you check the PR curve, you can see that it is not a very good model.
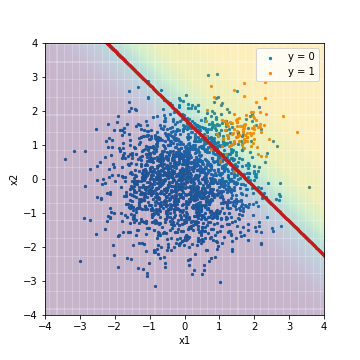
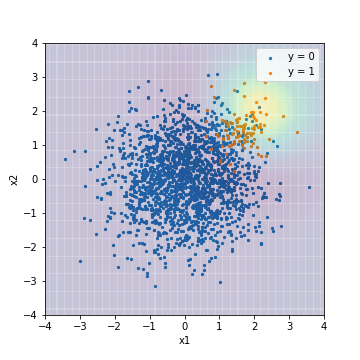
--Tuning with PR-AUC
| Accuacy | Precision | Recall | F1 | ROC-AUC | PR-AUC | |
|---|---|---|---|---|---|---|
| LR@PR-AUC | 0.950 | 0.000 | 0.000 | 0.000 | 0.975 | 0.632 |
Compared to the result of tuning with the F1 value, you can see that the background color is purple overall (it came to point to a negative example). In this result, all the data are below the threshold value, and the values are calculated after predicting that all the indicators based on the threshold value are negative examples. On the other hand, the ROC-AUC and PR-AUC values are the same as the results of tuning with the F1 value. This is because ROC-AUC and PR-AUC are not the absolute values of the scores, but are indicators that evaluate whether the prediction results are sorted in order of score, with positive examples at the top and negative examples at the bottom. In other words, it can be inferred that these two types of results have almost the same order when the prediction results are sorted in order of score, although the absolute values of the scores have changed.
Processing for the algorithm
Next is the result of logistic regression with processing applied to the algorithm. With scikit-learn, all you have to do is set the class_weight parameter.
#When applying processing to the algorithm
clf = LogisticRegression(class_weight="balanced")
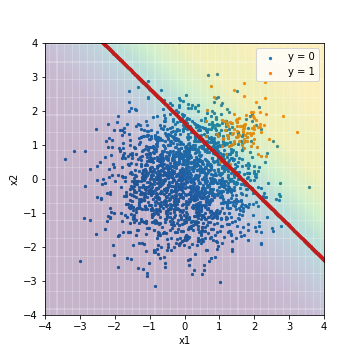
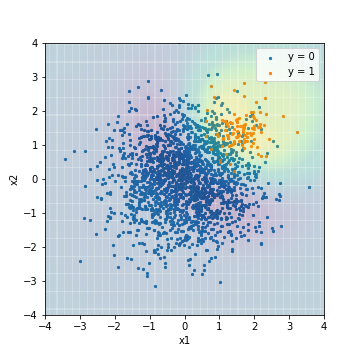
--Tuning with F1 value
| Accuacy | Precision | Recall | F1 | ROC-AUC | PR-AUC | |
|---|---|---|---|---|---|---|
| LR_weight@F1 | 0.901 | 0.329 | 0.950 | 0.488 | 0.975 | 0.633 |
--Tuning with PR-AUC
| Accuacy | Precision | Recall | F1 | ROC-AUC | PR-AUC | |
|---|---|---|---|---|---|---|
| LR_weight@PR-AUC | 0.887 | 0.301 | 0.950 | 0.457 | 0.975 | 0.631 |
Compared to the result of the normal logistic regression tuned with the F1 value earlier, you can see that the threshold location moves significantly to the lower left to correctly predict the positive example. Along with this, Recall is rising sharply. On the other hand, ROC-AUC and PR-AUC are not much different. In this case as well, it is considered that the order when the prediction results are sorted in the order of scores has not changed, as in the case of normal logistic regression.
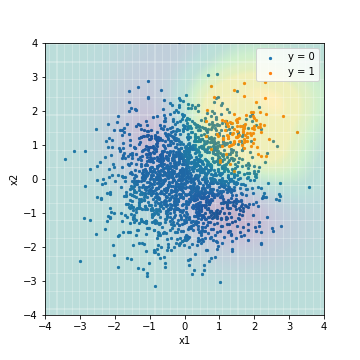
Processing on data
Finally, it is the result of logistic regression with processing applied to the data. It uses a technique called SMOTE Tomek, which is implemented in the imbalanced-learn library (https://imbalanced-learn.readthedocs.io/en/stable/) for imbalanced data prediction. This is a method that combines undersampling and downsampling. By applying SMOTETomek, the training data, which was originally 400 positive cases and 7600 negative cases, will be 7439 for both positive and negative cases.
--Tuning with F1 value

| Accuacy | Precision | Recall | F1 | ROC-AUC | PR-AUC | |
|---|---|---|---|---|---|---|
| LR_sampling@F1 | 0.891 | 0.308 | 0.950 | 0.466 | 0.975 | 0.632 |
--Tuning with PR-AUC
| Accuacy | Precision | Recall | F1 | ROC-AUC | PR-AUC | |
|---|---|---|---|---|---|---|
| LR_sampling@PR-AUC | 0.873 | 0.279 | 0.970 | 0.433 | 0.975 | 0.632 |
The result is almost the same as the result of logistic regression applying the processing for the algorithm. There is no big difference between each index.
The results of logistic regression are as follows. In this example, when evaluated from the perspective of PR-AUC, we can see that all models have the same performance.
| Accuacy | Precision | Recall | F1 | ROC-AUC | PR-AUC | |
|---|---|---|---|---|---|---|
| LR@F1 | 0.960 | 0.642 | 0.430 | 0.515 | 0.975 | 0.632 |
| LR@PR-AUC | 0.950 | 0.000 | 0.000 | 0.000 | 0.975 | 0.632 |
| LR_weight@F1 | 0.901 | 0.329 | 0.950 | 0.488 | 0.975 | 0.633 |
| LR_weight@PR-AUC | 0.887 | 0.301 | 0.950 | 0.457 | 0.975 | 0.631 |
| LR_sampling@F1 | 0.891 | 0.308 | 0.950 | 0.466 | 0.975 | 0.632 |
| LR_sampling@PR-AUC | 0.873 | 0.279 | 0.970 | 0.433 | 0.975 | 0.632 |
For SVM (RBF kernel)
Next, I made a similar comparison with the nonlinear model SVM (RBF kernel). The red line of the threshold is not shown here.
No action
The first is the prediction result of a normal SVM without any special measures.
--Tuning with F1 value
| Accuacy | Precision | Recall | F1 | ROC-AUC | PR-AUC | |
|---|---|---|---|---|---|---|
| SVM@F1 | 0.964 | 0.656 | 0.590 | 0.621 | 0.966 | 0.629 |
--Tuning with PR-AUC
| Accuacy | Precision | Recall | F1 | ROC-AUC | PR-AUC | |
|---|---|---|---|---|---|---|
| SVM@PR-AUC | 0.950 | 0.000 | 0.000 | 0.000 | 0.934 | 0.650 |
Unlike the result of logistic regression, there is a clear difference in the result depending on whether it is tuned with F1 value or PR-AUC. The score when tuned with PR-AUC is predicted to decrease radially from the upper right of the center of the example, which seems to be a reasonable result in this model without dealing with imbalanced data. .. On the contrary, the score when tuned with the F1 value looks a little unnatural. ** Actually PR-AUC tuned SVMs have higher PR-AUC than all logistic regression models, while SVMs tuned with F1 values have lower PR-AUC than all logistic regression models. I will. ** Based on this, it is thought that the evaluation index at the time of tuning is important when building a model with rich expressiveness.
Processing for the algorithm
Next is the result of the SVM adjusted for the algorithm.
clf = SVC(class_weight="balanced")
--Tuning with F1 value
| Accuacy | Precision | Recall | F1 | ROC-AUC | PR-AUC | |
|---|---|---|---|---|---|---|
| SVM_weight@F1 | 0.904 | 0.339 | 0.970 | 0.503 | 0.976 | 0.575 |
--Tuning with PR-AUC

| Accuacy | Precision | Recall | F1 | ROC-AUC | PR-AUC | |
|---|---|---|---|---|---|---|
| SVM_weight@PR-AUC | 0.050 | 0.050 | 1.00 | 0.095 | 0.978 | 0.639 |
In each of the results, it can be seen that the model is trained to predict the correct example more correctly than the normal SVM prediction result. On the other hand, the PR-AUC of SVM tuned with F1 value is 0.575, which is the worst ever.
Processing on data
Finally, it is the result of the SVM that applied the processing to the data.
--Tuning with F1 value
| Accuacy | Precision | Recall | F1 | ROC-AUC | PR-AUC | |
|---|---|---|---|---|---|---|
| SVM_sampling@F1 | 0.903 | 0.338 | 0.990 | 0.504 | 0.968 | 0.473 |
--Tuning with PR-AUC
| Accuacy | Precision | Recall | F1 | ROC-AUC | PR-AUC | |
|---|---|---|---|---|---|---|
| SVM_sampling@PR-AUC | 0.877 | 0.289 | 1.0 | 0.448 | 0.978 | 0.637 |
The overall trend was similar to the result of SVM applying the processing to the algorithm. On the other hand, the PR-AUC of the model tuned with the F1 value became even worse at 0.473.
The result of SVM is as follows. In this example, when evaluating from the perspective of PR-AUC, it was found that the performance drops significantly unless PR-AUC is set as the evaluation index when tuning. This is probably because SVM is a highly expressive model, so it is a model that specializes in the evaluation index used for tuning, compared to a linear model such as logistic regression.
| Accuacy | Precision | Recall | F1 | ROC-AUC | PR-AUC | |
|---|---|---|---|---|---|---|
| SVM@F1 | 0.964 | 0.656 | 0.590 | 0.621 | 0.966 | 0.629 |
| SVM@PR-AUC | 0.950 | 0.000 | 0.000 | 0.000 | 0.934 | 0.650 |
| SVM_weight@F1 | 0.904 | 0.339 | 0.970 | 0.503 | 0.976 | 0.575 |
| SVM_weight@PR-AUC | 0.050 | 0.050 | 1.00 | 0.095 | 0.978 | 0.639 |
| SVM_sampling@F1 | 0.903 | 0.338 | 0.990 | 0.504 | 0.968 | 0.473 |
| SVM_sampling@PR-AUC | 0.877 | 0.289 | 1.0 | 0.448 | 0.978 | 0.637 |
PR curve comparison
Finally, the PR curves of the 6 types of models (tuned with PR-AUC) tested in this experiment are arranged.
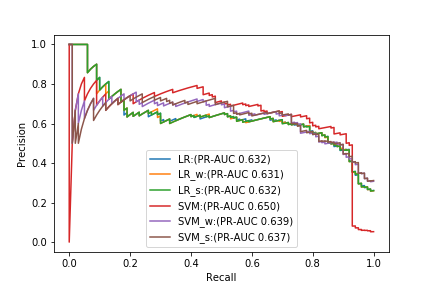
Comparing with PR-AUC alone, the best model is a normal SVM that does not deal with anything, but when the recall is high, the Precision of the SVM drops sharply, and it is better to use another model. I will. From this result, you can see that it is difficult to select an appropriate model with PR-AUC alone. Again, I think it's important to consider the balance between Precision and Recall from the ** PR curve and find the best performing model for that problem setting. ** **
Summary
--Let's draw a PR curve!
reference
-Imbalanced data --Implementation example of ROC curve defect -Differences in behavior between PR curve and ROC curve in imbalance data -Evaluation index of machine learning that can be understood from zero! Accuracy-Recall rate / ROC curve and AUC -Discussion on the difference between ROC curve and PR curve
[^ 1]: There is also an index called Fβ value, which is a generalization of F1 value. You can adjust the priority of Precision and Recall by adjusting the value of β. [^ 2]: Bias of prediction probability due to downsampling [^ 3]: Imbalanced-learn, a library of imbalanced data prediction, provides a convenient class called BalancedBaggingClassifier to implement this method. [^ 4]: Average Precision specified in the scoring parameter is an approximation of PR-ROC. Reference: https://scikit-learn.org/stable/modules/generated/sklearn.metrics.average_precision_score.html [^ 5]: GridSearchCV is divided into layers (while maintaining balance) by default for binary classification.
Recommended Posts