[PYTHON] How to visualize where misclassification is occurring in data analysis classification

Identify where the misclassification occurred to improve the accuracy of your data analysis results

That is the theme of this time.

So, today we will use the confusion matrix to visualize where the misclassification occurred.


from sklearn.tree import DecisionTreeClassifier
from sklearn.metrics import confusion_matrix

clf = DecisionTreeClassifier()

clf.fit(X_train, Y_train)
result = clf.predict(X_test)
cm = confusion_matrix(Y_test, result)

print(cm)


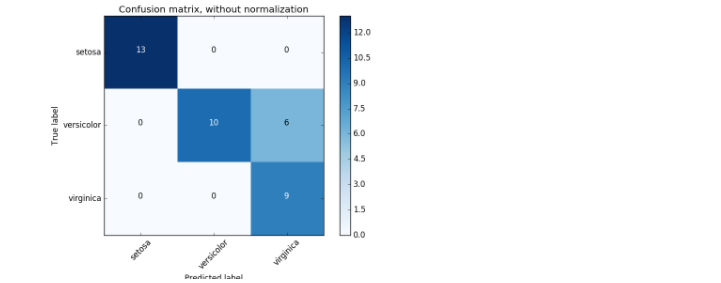
If you use the iris dataset, it will be visualized as shown in the figure below.

Screen Shot 2017-05-12 at 17.47.25.png Extracted from sklearn Official Document

It's a bit small and hard to see, but the y-axis is True value, that is, the correct labeling, the x-axis is Predicted value, and it's labeled using a machine learning model. Looking at the above figure, misclassification occurs in the center line and on the right.

Recognizing this, you may be able to improve the accuracy by reviewing the data preprocessing and readjusting the parameters of the machine learning model.

Recommended Posts

How to visualize where misclassification is occurring in data analysis classification
How to use is and == in Python
How to use data analysis tools for beginners
How to create data to put in CNN (Chainer)
How to read time series data in PyTorch
I want to visualize where and how many people are in the factory
How to replace with Pandas DataFrame, which is useful for data analysis (easy)
The first step to log analysis (how to format and put log data in Pandas)
How to study Python 3 engineer certification data analysis test by Python beginner (passed in September 2020)
How to use xgboost: Multi-class classification with iris data
How to apply markers only to specific data in matplotlib
[For beginners] How to study Python3 data analysis exam
How to plot the distribution of bacterial composition from Qiime2 analysis data in a box plot
How to test that Exception is raised in python unittest
How to generate exponential pulse time series data in python
How to get an overview of your data in Pandas
Data science companion in python, how to specify elements in pandas
How to develop in Python
How to handle data frames
How to give and what the constraints option in scipy.optimize.minimize is
How to judge that the cross key is input in Python3
<Pandas> How to handle time series data in a pivot table
How to create a large amount of test data in MySQL? ??
[Ln] How to paste a symbolic link in a directory is complicated
How to improve when Spyder's editor is very heavy in Mavericks
[Python] How to FFT mp3 data
[Python] How to do PCA in Python
How to handle session in SQLAlchemy
How to read e-Stat subregion data
How to write soberly in pandas
How to use SQLite in Python
How to deal with imbalanced data
How to convert 0.5 to 1056964608 in one shot
How to reflect CSS in Django
How to kill processes in bulk
How to use Mysql in python
How to Data Augmentation with PyTorch
How to wrap C in Python
How to use ChemSpider in Python
How to use PubChem in Python
How to run TensorFlow 1.0 code in 2.0
How to handle Japanese in Python
How to log in to Docker + NGINX
How to collect machine learning data
How to call PyTorch in Julia
How to send a visualization image of data created in Python to Typetalk
How to store CSV data in Amazon Kinesis Streams with standard input
Data analysis: Easily apply descriptive and inference statistics to CSV data in Python
How to plot galaxy visible light data using OpenNGC database in python