[PYTHON] [TF] I tried to visualize the learning result using Tensorboard
I tried to find out how to visualize the learning result using Tensorboard. For the method of outputting to Tensorboard, I referred to here.
Simple example
Suddenly it's difficult for a complicated one, so I made a simple example and tried it. As shown in the figure below, the test data had x as 5 dimensions and y as 3 dimensions, and after x was randomly generated, it was multiplied by W specified in advance and b was added to generate y. Since x is 5 dimensions and y is 3 dimensions, the size of W is 5x3. The code I ran is below, which is a slight modification of the code on the Tensorflow homepage to match the test data.

The points of the code are as follows.
- Create a SummaryWriter object like
writer = tf.train.SummaryWriter ("/ tmp / tensorflow_log ", sess.graph_def). Specify the directory to output log at that time. - Summarize the oprations that generate summary data with
merged = tf.merge_all_summaries (). operation means scalar_summary or histogram_summary. - Embed the operation in the code.
w_hist = tf.histogram_summary ("weights ", W)Like this. - Execute merged once every few times (once every 10 times in the code) like
result = sess.run ([merged, loss]). The loss is for outputting to standard output, so if you just want to output to Tensorboard, you do not need to execute it. - Pass the return value of sess.run to write. The code passes merged and loss to sess.run so the result comes back in a list. Since it is merged, result [0] is passed as
writer.add_summary (summary_str, step)like this. - When you have finished training, run tensorboard --logdir = / tmp / tensorflow_log.
- Start chrome in that state and access
http: // localhost: 6006to display TensorBoard, and if log output is successful, GRAPH will be displayed.
Below is the result of Tensorboard and the executed code.
GRAPH
 EVENTS
 HISTOGRAMS
 Code
Code
python
import tensorflow as tf
import numpy as np

WW = np.array([[0.1, 0.6, -0.9],
               [0.2, 0.5, -0.8],
               [0.3, 0.4, -0.7],
               [0.4, 0.3, -0.6],
               [0.5, 0.2, -0.5]]).astype(np.float32)
bb = np.array([0.3, 0.4, 0.5]).astype(np.float32)
x_data = np.random.rand(100,5).astype(np.float32)
y_data = np.dot(x_data, WW) + bb

with tf.Session() as sess:

    W = tf.Variable(tf.random_uniform([5,3], -1.0, 1.0))
    # The zeros set to zero with all elements.
    b = tf.Variable(tf.zeros([3]))
    #y = W * x_data + b
    y = tf.matmul(x_data, W) + b

    # Add summary ops to collect data
    w_hist = tf.histogram_summary("weights", W)
    b_hist = tf.histogram_summary("biases", b)
    y_hist = tf.histogram_summary("y", y)

    # Minimize the mean squared errors.
    loss = tf.reduce_mean(tf.square(y - y_data))
    # Outputs a Summary protocol buffer with scalar values
    loss_summary = tf.scalar_summary("loss", loss)

    # Gradient descent algorithm
    optimizer = tf.train.GradientDescentOptimizer(0.5)
    train = optimizer.minimize(loss)

    # Before starting, initialize the variables.  We will 'run' this first.
    init = tf.initialize_all_variables()

    # Creates a SummaryWriter
    # Merges all summaries collected in the default graph
    merged = tf.merge_all_summaries()
    writer = tf.train.SummaryWriter("/tmp/tensorflow_log", sess.graph_def)
    sess.run(init)

    # Fit the line
    for step in xrange(501):
        if step % 10 == 0:
            result = sess.run([merged, loss])
            summary_str = result[0]
            acc = result[1]
            writer.add_summary(summary_str, step)
            print"step = %s acc = %s W = %s b = %s" % (step, acc, sess.run(W), sess.run(b))
        else:
            sess.run(train)
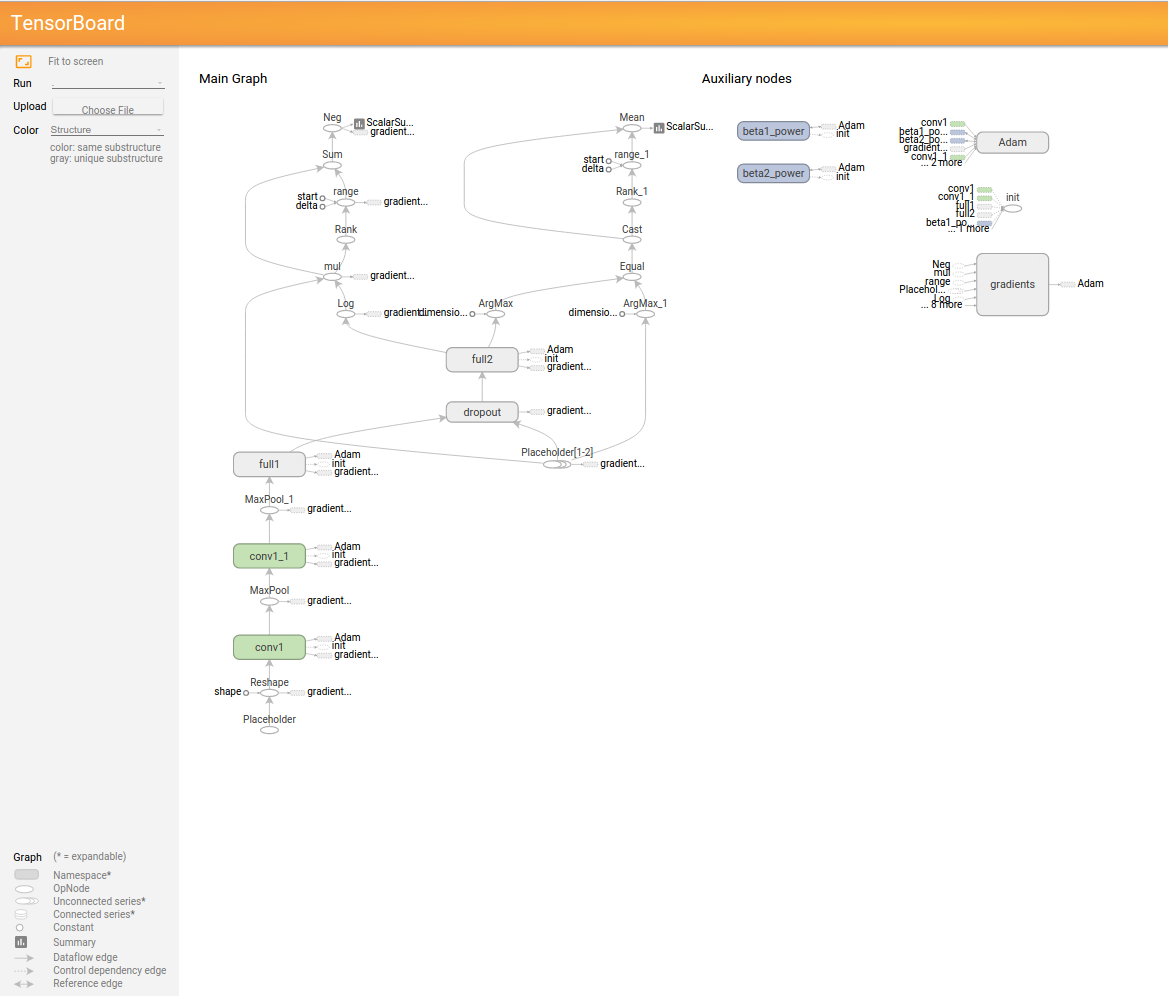
A little more complicated example
When grouping histograms, make the xxx of the histograms you want to group the same, such as tf.histogram_summary ("xxx / weights", w) ,tf.histogram_summary ("xxx / biases", b).
Below is the result of Tensorboard and the executed code.
GRAPH
 EVENTS
 HISTOGRAMS
 Code
Code
python
import input_data
import tensorflow as tf

print 'load MNIST dataset'
mnist = input_data.read_data_sets("MNIST_data", one_hot=True)

def weight_variable(shape):
    initial = tf.truncated_normal(shape, stddev=0.1)
    return tf.Variable(initial)

def bias_variable(shape):
    initial = tf.constant(0.1, shape = shape)
    return tf.Variable(initial)

def conv2d(x, W):
    return tf.nn.conv2d(x, W, strides=[1,1,1,1], padding='SAME')
def max_pool_2x2(x):
    return tf.nn.max_pool(x, ksize=[1,2,2,1], strides=[1,2,2,1], padding='SAME')

def _write_histogram_summary(parent, infos):
    for i in infos:
        tf.histogram_summary("%s/%s" % (parent, i[0]), i[1])

with tf.Session() as sess:
    x = tf.placeholder("float", [None, 784])
    y_ = tf.placeholder("float", [None, 10])

    # 1x28x28 -> 32x28x28 -> 32x14x14
    x_image = tf.reshape(x, [-1,28,28,1])
    with tf.variable_scope('conv1') as scope:
        W_conv1 = weight_variable([5, 5, 1, 32])
        b_conv1 = bias_variable([32])
        h_conv1 = tf.nn.relu(conv2d(x_image, W_conv1) + b_conv1, name=scope.name)

        _write_histogram_summary('conv1', [['weights', W_conv1],['biases', b_conv1], ['activations', h_conv1]])

    h_pool1 = max_pool_2x2(h_conv1)

    # 32x14x14 -> 64x7x7
    with tf.variable_scope('conv1') as scope:
        W_conv2 = weight_variable([5, 5, 32, 64])
        b_conv2 = bias_variable([64])
        h_conv2 = tf.nn.relu(conv2d(h_pool1, W_conv2) + b_conv2, name=scope.name)

        _write_histogram_summary('conv2', [['weights', W_conv2],['biases', b_conv2], ['activations', h_conv2]])

    h_pool2 = max_pool_2x2(h_conv2)

    # 64x7x7 -> 1024
    with tf.variable_scope('full1') as scope:
        W_fc1 = weight_variable([7 * 7 * 64, 1024])
        b_fc1 = bias_variable([1024])
        h_pool2_flat = tf.reshape(h_pool2, [-1, 7*7*64])
        h_fc1 = tf.nn.relu(tf.matmul(h_pool2_flat, W_fc1) + b_fc1, name=scope.name)

        _write_histogram_summary('full1', [['weights', W_fc1],['biases', b_fc1], ['activations', h_fc1]])

    # dropout
    keep_prob = tf.placeholder("float")
    h_fc1_drop = tf.nn.dropout(h_fc1, keep_prob)

    # Readout
    with tf.variable_scope('full2') as scope:
        W_fc2 = weight_variable([1024, 10])
        b_fc2 = bias_variable([10])

        y_conv=tf.nn.softmax(tf.matmul(h_fc1_drop, W_fc2) + b_fc2, name=scope.name)

        _write_histogram_summary('full2', [['weights', W_fc2],['biases', b_fc2]])

    tf.histogram_summary("y", y_conv)

    cross_entropy = -tf.reduce_sum(y_*tf.log(y_conv))

    train_step = tf.train.AdamOptimizer(1e-4).minimize(cross_entropy)
    correct_prediction = tf.equal(tf.argmax(y_conv,1), tf.argmax(y_,1))
    accuracy = tf.reduce_mean(tf.cast(correct_prediction, "float"))


    tf.scalar_summary("cross_entropy", cross_entropy)
    tf.scalar_summary("accuracy", accuracy)

    # Before starting, initialize the variables.  We will 'run' this first.
    init = tf.initialize_all_variables()

    # Creates a SummaryWriter
    # Merges all summaries collected in the default graph
    merged = tf.merge_all_summaries()
    writer = tf.train.SummaryWriter("/tmp/tensorflow_log_mnist", sess.graph_def)

    sess.run(init)

    # training
    N = len(mnist.train.images)
    N_test = len(mnist.test.images)
    n_epoch = 20000
    batchsize = 50

    for i in range(n_epoch):
        batch = mnist.train.next_batch(batchsize)
        if i%100 == 0:
            summary_str, loss_value = sess.run([merged, accuracy], feed_dict={x: batch[0], y_: batch[1], keep_prob: 0.5})
            writer.add_summary(summary_str, i)
            print "step %d %.2f" % (i, loss_value)
        sess.run(train_step, feed_dict={x: batch[0], y_: batch[1], keep_prob: 0.5})

    tacc = 0
    tbatchsize = 1000
    for i in range(0,N_test,tbatchsize):
        acc = sess.run(accuracy, feed_dict={
        x: mnist.test.images[i:i+tbatchsize], y_: mnist.test.labels[i:i+tbatchsize], keep_prob: 1.0})
        tacc += acc * tbatchsize

        print "test step %d acc = %.2f" % (i//tbatchsize, acc)
    tacc /= N_test
    print "test accuracy %.2f" % tacc
Recommended Posts