[PYTHON] I tried the changefinder library!

Qiita's first post! !! It's easy for a new graduate first year engineer (* ´ ▽ ` *) Reference site: [changefinder] (http://argmax.jp/index.php?changefinder)

background

I recently heard a voice saying "I want to know if PV is skyrocketing!" And tried it. In such cases, it seems that measurement is often performed using change point detection and outlier detection. While investigating, there were some examples where a model called changefinder was used.

[Introduction of the method and system for identifying soaring words using "Ameba" and "Twitter"] (https://www.cyberagent.co.jp/techinfo/techreport/report/id=9749)

There are packages in R and Python, so this time I tried the sample code of the python package that I have never touched!

R: [I made a package for anomaly detection (change point detection)] (http://d.hatena.ne.jp/yokkuns/20120930/1348978641)

Python: [changefinder] (http://argmax.jp/index.php?changefinder)

Practice

The editor used jupyter, which is a hot topic in the Python area recently. How to install jupyter nootbook is summarized in here. jupyter is a recommended editor for interactive code modification, data acquisition and plotting.

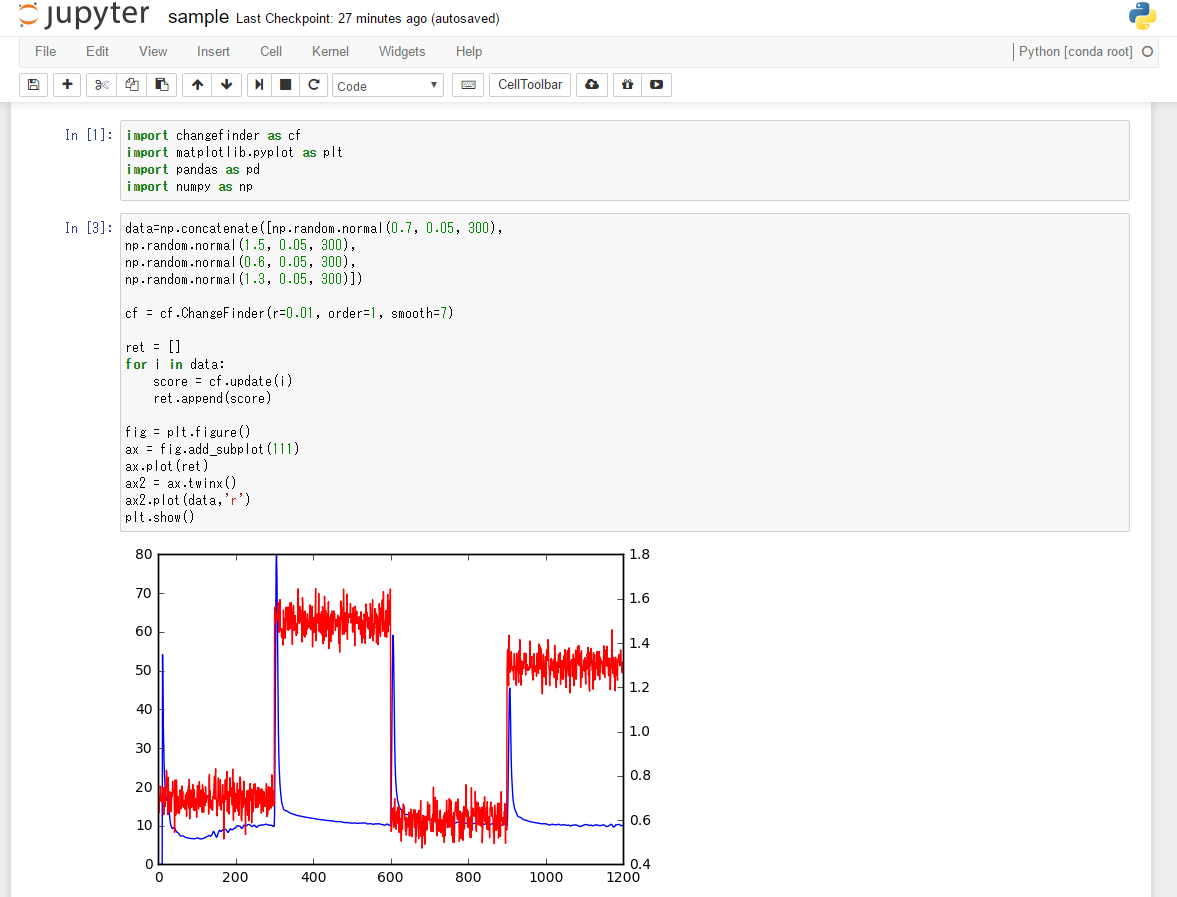
When I hit the sample code with jupyter, it looks like this

jupyter.PNG

First, install the changefinder package Install the required libraries

pip install changefinder

matplotlib.pyplot is a standard library of graph plots. numpy is a convenient library that various functions that generate random numbers say. Pandas contains types that make data manipulation convenient, such as data frames.

import changefinder as cf
import matplotlib.pyplot as plt
import pandas as pd
import numpy as np

Create the data to be analyzed. Random numbers with low, high, low, and high mean values are created and stored.

data=np.concatenate([
np.random.normal(0.7, 0.05, 300),
np.random.normal(1.5, 0.05, 300),
np.random.normal(0.6, 0.05, 300),
np.random.normal(1.3, 0.05, 300)])

Set the parameters.

cf = changefinder.ChangeFinder(r=0.01, order=1, smooth=100)

Put the score in an array

ret = []
for i in data:
    score = cf.update(i)
    ret.append(score)

It is a graph plot.

fig = plt.figure()
ax = fig.add_subplot(111)
ax.plot(ret)
ax2 = ax.twinx()
ax2.plot(data,'r')
plt.show()

Summary

With jupyter, you can do it interactively, so you can easily try various packages!

Recommended Posts

I tried the changefinder library!
I tried using the functional programming library toolz
I tried the TensorFlow tutorial 1st
I tried the Naro novel API 2
I tried the TensorFlow tutorial 2nd
I tried the Naruro novel API
I tried to move the ball
I tried using the checkio API
I tried to estimate the interval.
I tried using the Python library from Ruby with PyCall
I tried touching the multi-vendor router control API library NAPALM
I tried the TensorFlow tutorial MNIST 3rd
I tried to summarize the umask command
I tried tensorflow for the first time
I tried scraping
I tried to recognize the wake word
I tried PyQ
I tried the OSS visualization tool, superset
I tried AutoKeras
I tried to summarize the graphical modeling.
I tried to estimate the pi stochastically
Continuation ・ I tried touching the multi-vendor router control API library NAPALM
I tried to touch the COTOHA API
I tried papermill
Python: I tried the traveling salesman problem
I tried playing with the image with Pillow
I tried django-slack
I tried Django
I tried spleeter
I tried cgo
I tried the Python Tornado Testing Framework
I tried using the BigQuery Storage API
I tried using the trained model VGG16 of the deep learning library Keras
I tried to visualize the model with the low-code machine learning library "PyCaret"
I tried "smoothing" the image with Python + OpenCV
I tried web scraping to analyze the lyrics.
I tried using scrapy for the first time
[Python] I tried substituting the function name for the function name
I tried cluster analysis of the weather map
I tried hitting the Qiita API from go
vprof --I tried using the profiler for Python
I tried "differentiating" the image with Python + OpenCV
I tried to optimize while drying the laundry
I tried to save the data with discord
I tried simulating the "birthday paradox" in Python
I tried the least squares method in Python
I tried using PyCaret at the fastest speed
I tried using the Google Cloud Vision API
I tried to touch the API of ebay
I tried python programming for the first time.
I tried to correct the keystone of the image
I tried to touch Python's GUI library "PySimple GUI"
I tried "binarizing" the image with Python + OpenCV
I tried using the Datetime module by Python
I tried Mind Meld for the first time
I tried the Pepper NAOqi OS 2.5.5 SLAM feature
Qiita Job I tried to analyze the job offer
I tried using the image filter of OpenCV
LeetCode I tried to summarize the simple ones
I tried playing with the calculator on tkinter
I tried to implement the traveling salesman problem