[PYTHON] How to eliminate garbled characters in matplotlib output image
You can draw a graph in python that you can draw in Excel.
A package called matplotlib provides that function.
Is the meaning of drawing what can be drawn in Excel in a script language mainly for automation?
It can be used for applications such as periodically acquiring data that is updated daily, graphing it, and automating the sending of the image by e-mail.
Here, as an example, [Tuition transition data of national private universities published by the Ministry of Education, Culture, Sports, Science and Technology](http://www.mext.go.jp/b_menu/shingi/kokuritu/005/gijiroku/06052921/005/ 002.htm) is used.
Save it as a data.csv file as shown below. (It has been properly formatted, such as replacing spaces with, with vim)
year,Tuition (yen),Admission fee (yen),Examination fee (yen),Tuition (yen),Admission fee (yen),Examination fee (yen),Tuition (double),Admission fee (double),Examination fee (double)
1975,36000,50000,5000,182677,95584,9647,5.1,1.9,1.9
1976,96000,50000,7500,221844,121888,11452,2.3,2.4,1.5
1977,96000,60000,7500,248066,135205,13084,2.6,2.3,1.7
1978,144000,60000,10000,286568,157019,14722,2,2.6,1.5
...
The actual tuition data for each national and private school is read by python, listed, adjusted for label settings and case display settings, and finally written to graph.png.
from matplotlib import pyplot

with open("data.csv", "r", encoding="shift-jis") as fp:
    x, xlabels = [], []
    y1, y2 = [], []
    for linenum, line in enumerate(fp):
        if linenum is 0:
            continue
        x.append(linenum)
        xlabels.append(line.split(",")[0])
        y1.append(line.split(",")[1])
        y2.append(line.split(",")[4])

#x-axis label setting
pyplot.xticks(x, xlabels, rotation=90)
#Expanded x-axis label display space
pyplot.subplots_adjust(bottom=0.2)

#Draw with a solid cyan line
pyplot.plot(x, y1, 'c-', label="National university")
#Draw with solid line of magenda
pyplot.plot(x, y2, 'm-', label="private university")

# grid, title,Legend display
pyplot.title("Changes in tuition fees, etc. at national and private universities")
pyplot.legend()
pyplot.grid()

#pyplot.show()
pyplot.savefig("graph.png ")
The result is shown in the figure below.
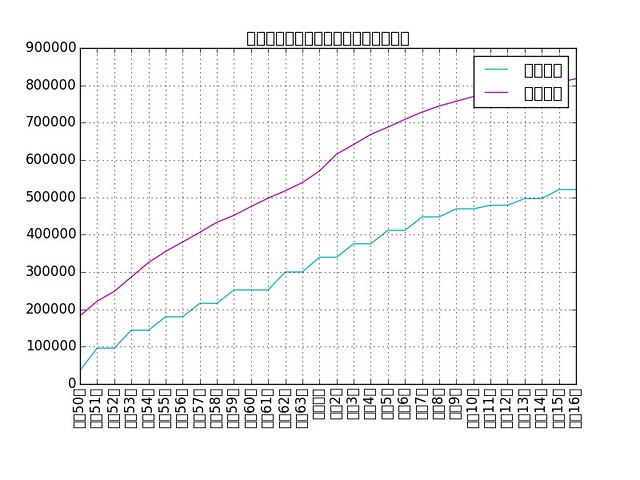
So-called tofu ... This is because matplotlib does not have Japanese fonts.
It's a bit old and python2 information, but [How to set Helvetica as the default sans-serif font in Matplotlib](http://blog.olgabotvinnik.com/blog/2012/11/15/2012-11-15- How-to-set-helvetica-as-the-default-sans-serif-font-in /) explains how to add fonts. [^ 1]
You can pull a font that supports Japanese from the system, but I couldn't find the ttf font on my Mac, so IPA font /download.html#en).
Unzip the downloaded zip file and copy it as follows. Please note that the copy destination depends on the environment.
$ cp ~/Downloads/IPAfont00303/*.ttf /usr/local/lib/python3.4/site-packages/matplotlib/mpl-data/fonts/ttf/
Copy the config file under your home and edit it.
$ cp /usr/local/lib/python3.4/site-packages/matplotlib/mpl-data/matplotlibrc ~/.matplotlib/
$ vi ~/.matplotlib/matplotlibrc
Set the font name in font.family.
Please note that the font file name is not specified here.
ʻOpen ipa.ttf`, check the font name you want to use, and then set it.
matplotlibrc
# The font.size property is the default font size for text, given in pts.
# 12pt is the standard value.
#
font.family         : IPAmincho
Delete the cached data.
$ rm ~/.matplotlib/fontList.py3k.cache
Now, the next time you do ʻimport matplotlib`, the cache data will be automatically generated and you will be able to display it in Japanese.
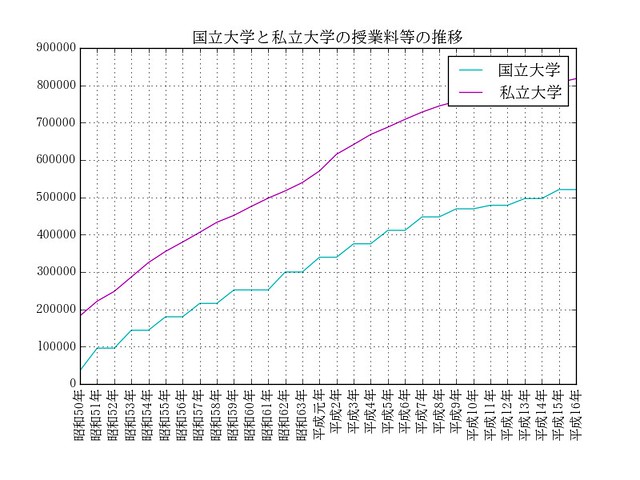
If you re-execute the python script, you can see that the tofu has been eliminated as shown below.
[^ 1]: matplotlib standard fonts are not beautiful! And angry
Recommended Posts