[PYTHON] How to use x-means
k-means system summary
--k-means: Minimize the squared error from the center of gravity of the cluster. --k-medoids: Perform the EM procedure so that the sum of dissimilarities from the cluster medoids (points belonging to the cluster that minimize the sum of dissimilarities) is minimized. --x-means: Controls cluster division based on BIC. --g-menas: Control cluster division by Anderson darling test, assuming the data is based on a normal distribution. --gx-means: The above two extensions. --etc (See the readme of pyclustering. There are various)
Determining the number of clusters
It would be nice if humans could see the data immediately and know the number of clusters, but that is rare, so I want a quantitative judgment method.
According to sklearn cheat sheet
- MeanShift
- VBGMM
Is recommended.
Is also useful, but in my experience, it was rare for me to get a beautiful elbow (a point where the graph becomes jerky), and I was often confused about the number of clusters.
There is x-means as a method of clustering with the number of clusters fully automatically.
Below, how to use the library "pyclustering" that contains various clustering methods including x-means.
How to use pyclustering
pyclustering is a library of clustering algorithms implemented in both python and C ++.
Installation
Dependent packages: scipy, matplotlib, numpy, PIL
pip install pyclustering
x-means usage example
In addition to the EM step in k-means, x-means determines a new step: whether it is appropriate for a cluster to be represented by two or one normal distributions, and two are If appropriate, the operation is to divide the cluster into two.
Below, jupyter notebook is used.
import numpy as np
import pandas as pd
import matplotlib.pyplot as plt
from sklearn import cluster, preprocessing

#Wine dataset
df_wine_all=pd.read_csv('https://archive.ics.uci.edu/ml/machine-learning-databases/wine/wine.data', header=None)
#Variety(Row 0, 1-3)And color (10 rows) and amount of proline(13 rows)To use
df_wine=df_wine_all[[0,10,13]]
df_wine.columns = [u'class', u'color', u'proline']

#Data shaping
X=df_wine[["color","proline"]]
sc=preprocessing.StandardScaler()
sc.fit(X)
X_norm=sc.transform(X)

#plot
%matplotlib inline

x=X_norm[:,0]
y=X_norm[:,1]
z=df_wine["class"]
plt.figure(figsize=(10,10))
plt.subplot(4, 1, 1)
plt.scatter(x,y, c=z)
plt.show

# x-means
from pyclustering.cluster.xmeans import xmeans
from pyclustering.cluster.center_initializer import kmeans_plusplus_initializer
xm_c = kmeans_plusplus_initializer(X_norm, 2).initialize()
xm_i = xmeans(data=X_norm, initial_centers=xm_c, kmax=20, ccore=True)
xm_i.process()

#Plot the results
z_xm = np.ones(X_norm.shape[0])
for k in range(len(xm_i._xmeans__clusters)):
    z_xm[xm_i._xmeans__clusters[k]] = k+1

plt.subplot(4, 1, 2)
plt.scatter(x,y, c=z_xm)
centers = np.array(xm_i._xmeans__centers)
plt.scatter(centers[:,0],centers[:,1],s=250, marker='*',c='red')
plt.show

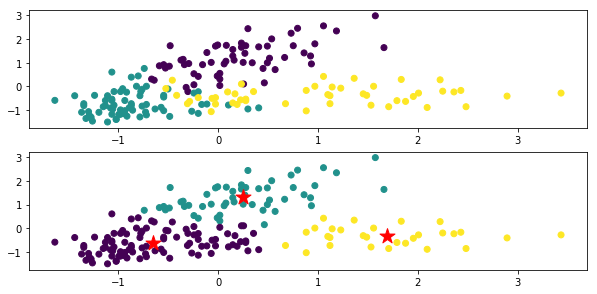
The top is a figure colored for each original data class, and the bottom is the clustering result by x-means. The ★ mark is the center of gravity of each class.
In the code xm_c = kmeans_plusplus_initializer (X_norm, 2) .initialize (), the initial value of the number of clusters is set to 2, but it clusters properly to 3.
I am running x-means with xm_i.process ().
For the x-means instance (xm_i in the above code), if you look at the instance variables before and after learning, you can see what the learning result looks like. For example
xm_i.__dict__.keys()
Or
vars(xm_i).keys()
Can be obtained with
dict_keys(['_xmeans__pointer_data', '_xmeans__clusters', '_xmeans__centers', '_xmeans__kmax', '_xmeans__tolerance', '_xmeans__criterion', '_xmeans__ccore'])
I think you should look at various things such as.
_xmeans__pointer_data
A copy of the data to be clustered.
_xmeans__clusters
A list showing which line of the original data (\ _xmeans__pointer_data) belongs to each cluster.
The number of elements in the list is the same as the number of clusters, each element is also a list, and the number of the line belonging to the cluster is stored.
_xmeans__centers
A list consisting of the coordinates (list) of the centroid of each cluster
_xmeans__kmax
Maximum number of clusters (set value)
_xmeans__tolerance
A constant that defines the stop condition for x-means iteration. The algorithm terminates when the maximum change in the center of gravity of the cluster falls below this constant.
_xmeans__criterion
It is a judgment condition of cluster division. Default: BIC
_xmeans__ccore
This is the setting value for whether to use C ++ code instead of python code.
Recommended Posts