[PYTHON] Decision tree and random forest
What is a decision tree?
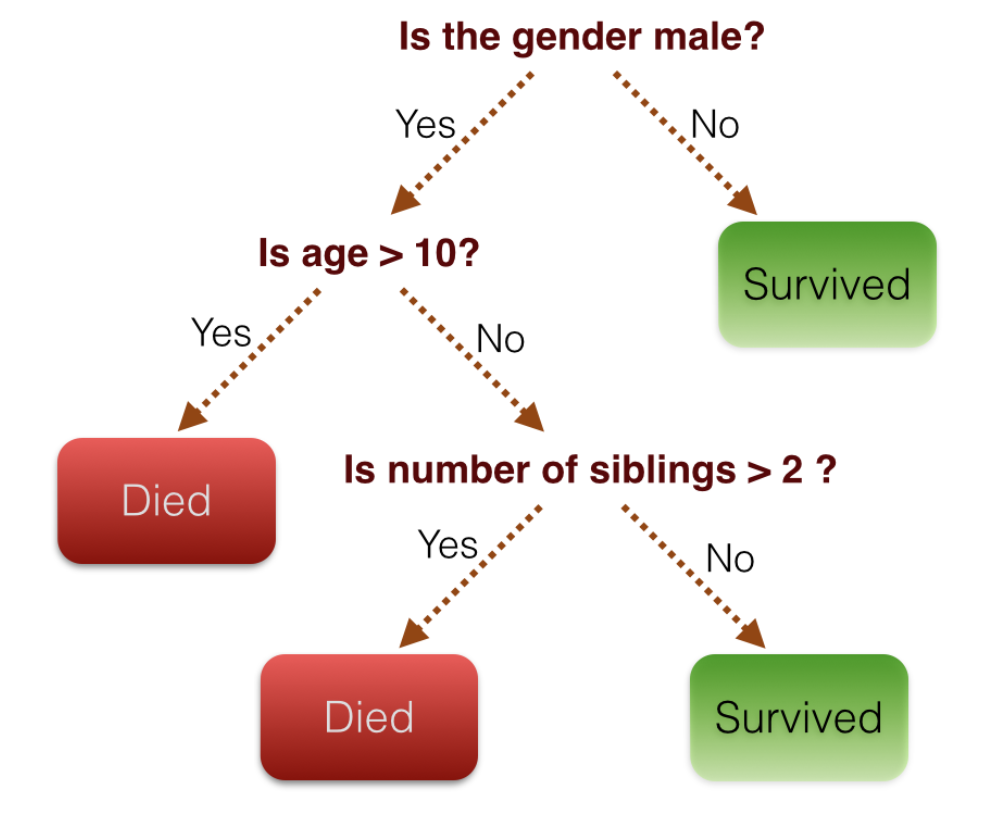
A method of calculating the probability of belonging to an objective variable by combining multiple explanatory variables. The image below calculates the probability based on whether it belongs to conditions such as Yes / No.
What is Random Forest?
Random forest is one of the ensemble learning methods (classifiers composed of multiple classifiers). Since multiple decision trees are collected and used, the trees are collected and used as a forest.
Try it (decision tree in sklearn)
Data ready
Prepare randomly created data.
{get_dummy_dataset.py}
import numpy as np
import pandas as pd
import matplotlib.pyplot as plt
import seaborn
%matplotlib inline

from sklearn.datasets import make_blobs #For generating dummy data
X, y = make_blobs(n_samples=500, centers=4, random_state=8, cluster_std=2.4)
# n_samples:Number of samples centers:Number of center points random_state:seed value cluster_std:Degree of variation
Data overview
{display_dummy_dataset.py}
plt.figure(figsize =(10,10))
plt.scatter(X[:, 0], X[:, 1], c=y, s=50, cmap='jet')
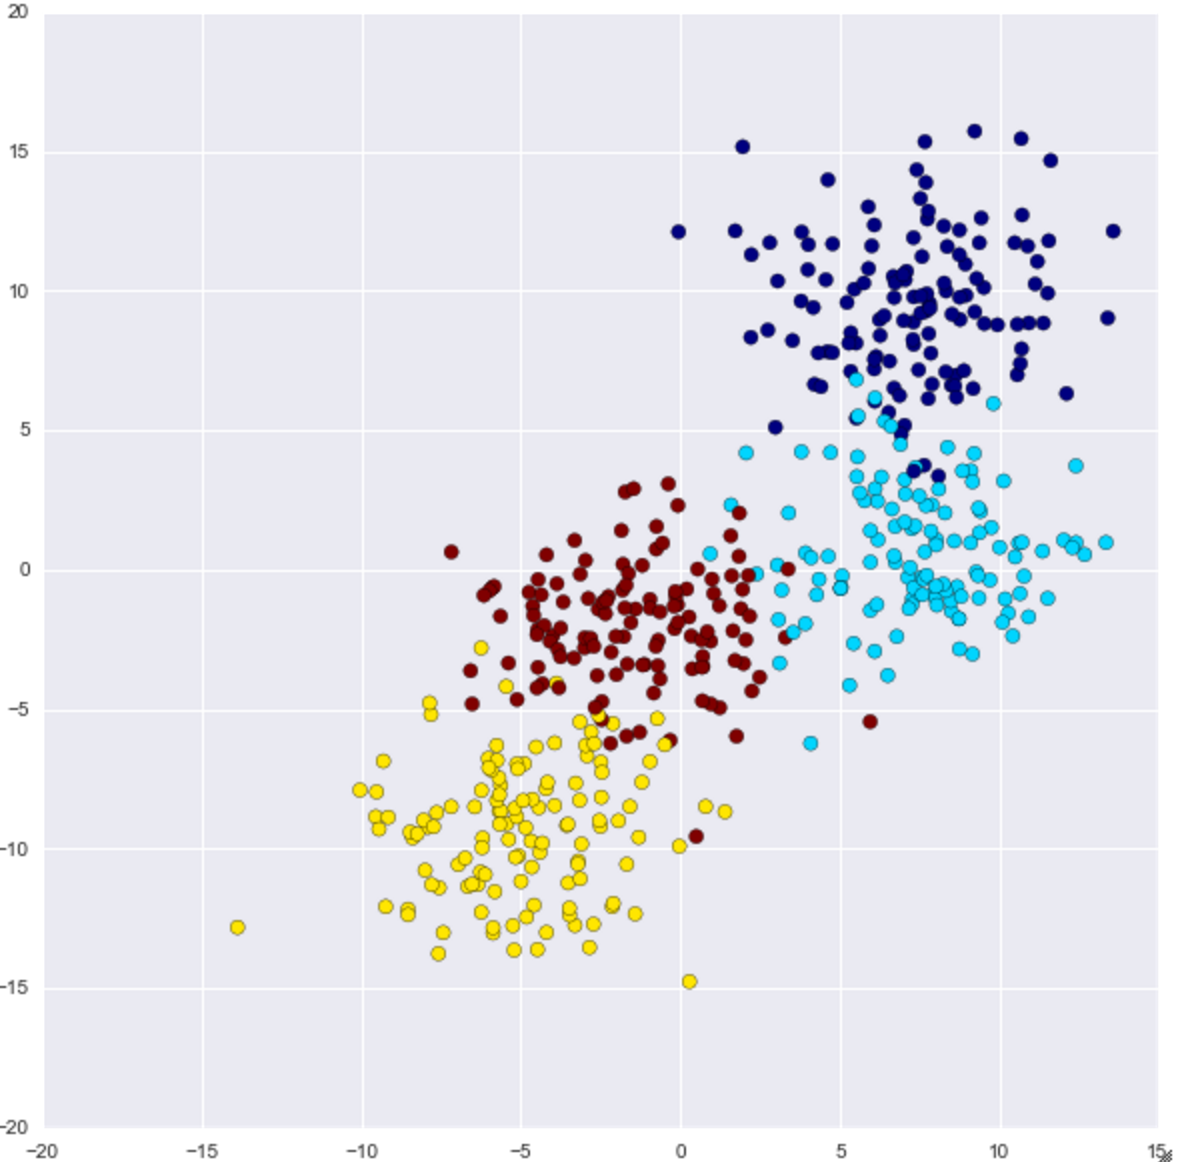
The distribution of 500 data generated from the four center points looks like this.
Try a decision tree
The code for visualize_tree is written at the bottom.
{do_decision_tree.py}
from sklearn.tree import DecisionTreeClassifier             #For decision trees
clf = DecisionTreeClassifier(max_depth=2, random_state = 0) #Instance creation max_depth:Tree depth
visualize_tree(clf, X, y)    #Draw execution
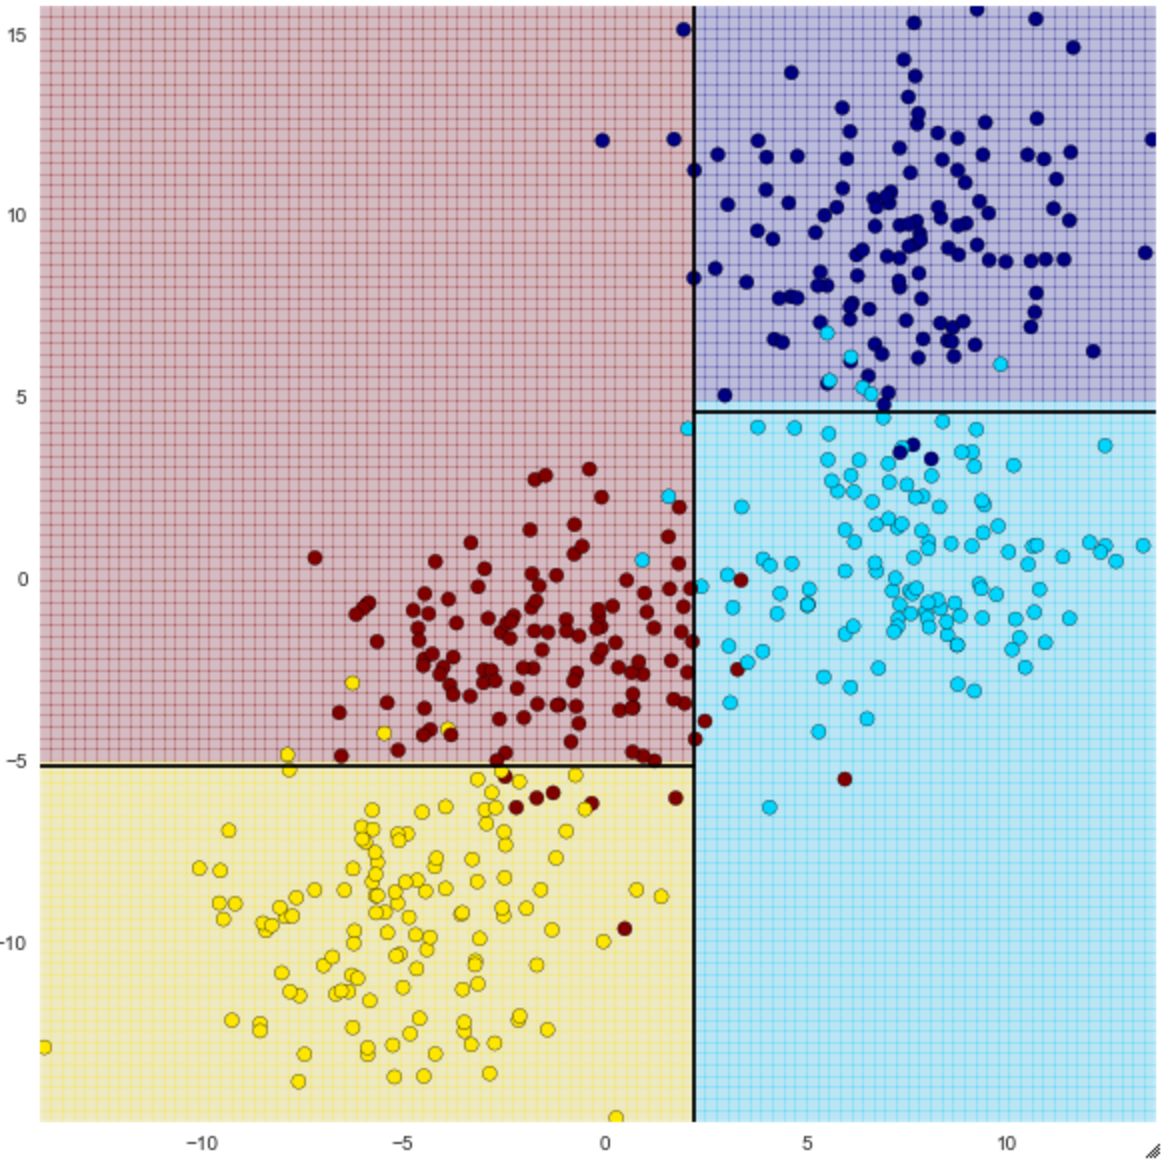
You can see how it can be classified into four using straight lines. The accuracy changes depending on the number of depths (max_depth) of the decision tree, so when I set max_depth to 4, it became as follows.
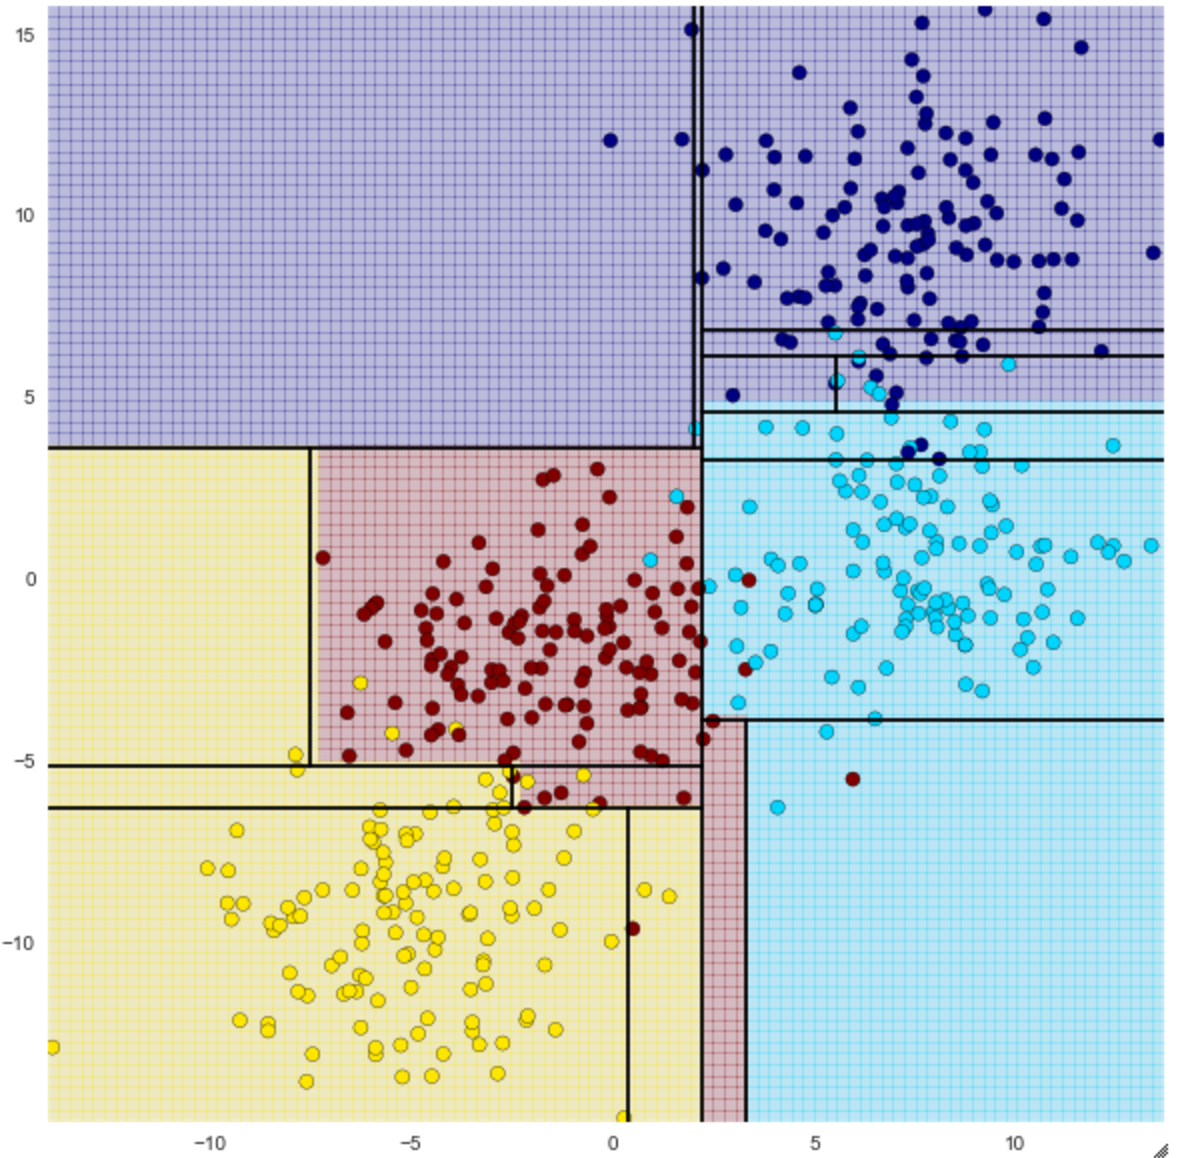
From depth 2, you can see that you are trying to make a finer classification.
However, the greater the depth, the higher the accuracy of the training data, but the easier it is to overfit. To avoid this, try running a random forest.
Try Random Forest
{do_random_forest.py}
from sklearn.ensemble import RandomForestClassifier #For random forest
clf = RandomForestClassifier(n_estimators=100, random_state=0) #Instance creation n_estimators:Specifying the number of decision trees to make
visualize_tree(clf, X, y, boundaries=False)
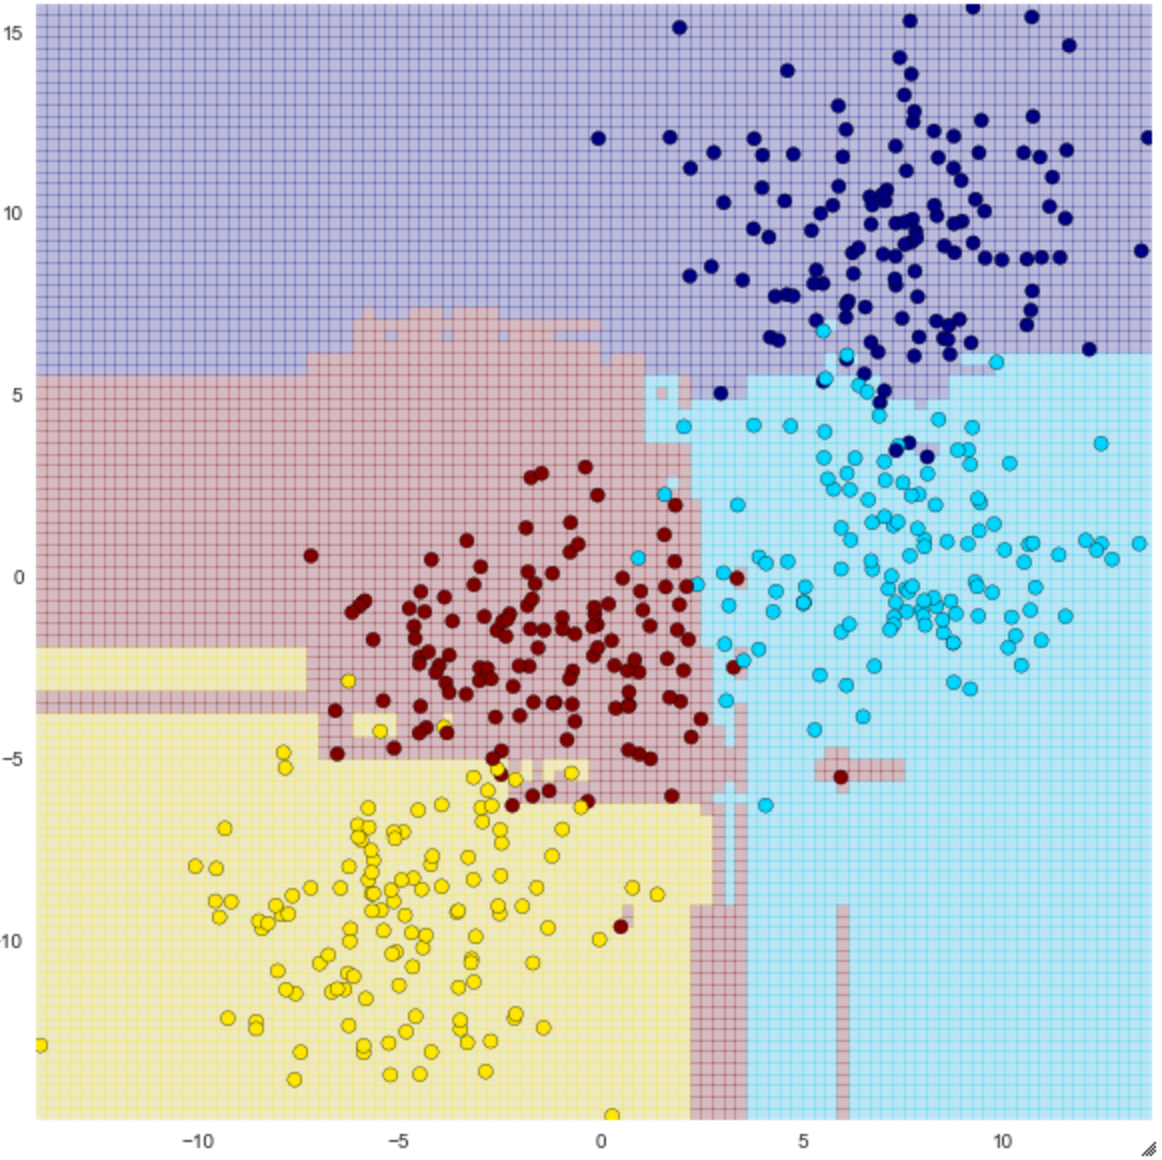
You can see that the classification is not a simple straight line, but it seems to be more accurate than one decision tree. By the way, doing this does not always prevent overfitting. For example, the red circle in the lower right of the above figure seems to be outlier, but it is grouped with red.
A function that visualizes the result.
{visualize_tree.py}
#Try drawing a decision tree
def visualize_tree(classifier, X, y, boundaries=True,xlim=None, ylim=None):
    """Visualization function of decision tree.
    INPUTS:Classification model, X, y, optional x/y limits.
    OUTPUTS:Visualization of decision trees using Meshgrid
    """
    #Building a model using fit
    classifier.fit(X, y)

    #Automatic adjustment of axis
    if xlim is None:
        xlim = (X[:, 0].min() - 0.1, X[:, 0].max() + 0.1)
    if ylim is None:
        ylim = (X[:, 1].min() - 0.1, X[:, 1].max() + 0.1)

    x_min, x_max = xlim
    y_min, y_max = ylim


    #Create a mesh grid.
    xx, yy = np.meshgrid(np.linspace(x_min, x_max, 100),np.linspace(y_min, y_max, 100))

    #Perform classifier predictions
    Z = classifier.predict(np.c_[xx.ravel(), yy.ravel()])

    #Shaped using meshgrid.
    Z = Z.reshape(xx.shape)

    #Colored by classification.
    plt.figure(figsize=(10,10))
    plt.pcolormesh(xx, yy, Z, alpha=0.2, cmap='jet')

    #Drawing of training data.
    plt.scatter(X[:, 0], X[:, 1], c=y, s=50, cmap='jet')

    plt.xlim(x_min, x_max)
    plt.ylim(y_min, y_max)

    def plot_boundaries(i, xlim, ylim):
        '''
Draw a border.
        '''
        if i < 0:
            return

        tree = classifier.tree_

        #Call recursively to draw the boundary.
        if tree.feature[i] == 0:
            plt.plot([tree.threshold[i], tree.threshold[i]], ylim, '-k')
            plot_boundaries(tree.children_left[i], [xlim[0], tree.threshold[i]], ylim)
            plot_boundaries(tree.children_right[i], [tree.threshold[i], xlim[1]], ylim)

        elif tree.feature[i] == 1:
            plt.plot(xlim, [tree.threshold[i], tree.threshold[i]], '-k')
            plot_boundaries(tree.children_left[i], xlim,
                            [ylim[0], tree.threshold[i]])
            plot_boundaries(tree.children_right[i], xlim,
                            [tree.threshold[i], ylim[1]])

    if boundaries:
        plot_boundaries(0, plt.xlim(), plt.ylim())
Try regression in Random Forest
Random forests can also regress.
Use sin to prepare data that makes small waves move in large waves
{get_dummy_malti_sin_dataset.py}
from sklearn.ensemble import RandomForestRegressor

x = 10 * np.random.rand(100)

def sin_model(x, sigma=0.2):
    """Dummy data consisting of large waves + small waves + noise."""
    noise = sigma * np.random.randn(len(x))

    return np.sin(5 * x) + np.sin(0.5 * x) + noise

#Calculate y from x
y = sin_model(x)

#Try Plot.
plt.figure(figsize=(16,8))
plt.errorbar(x, y, 0.1, fmt='o')
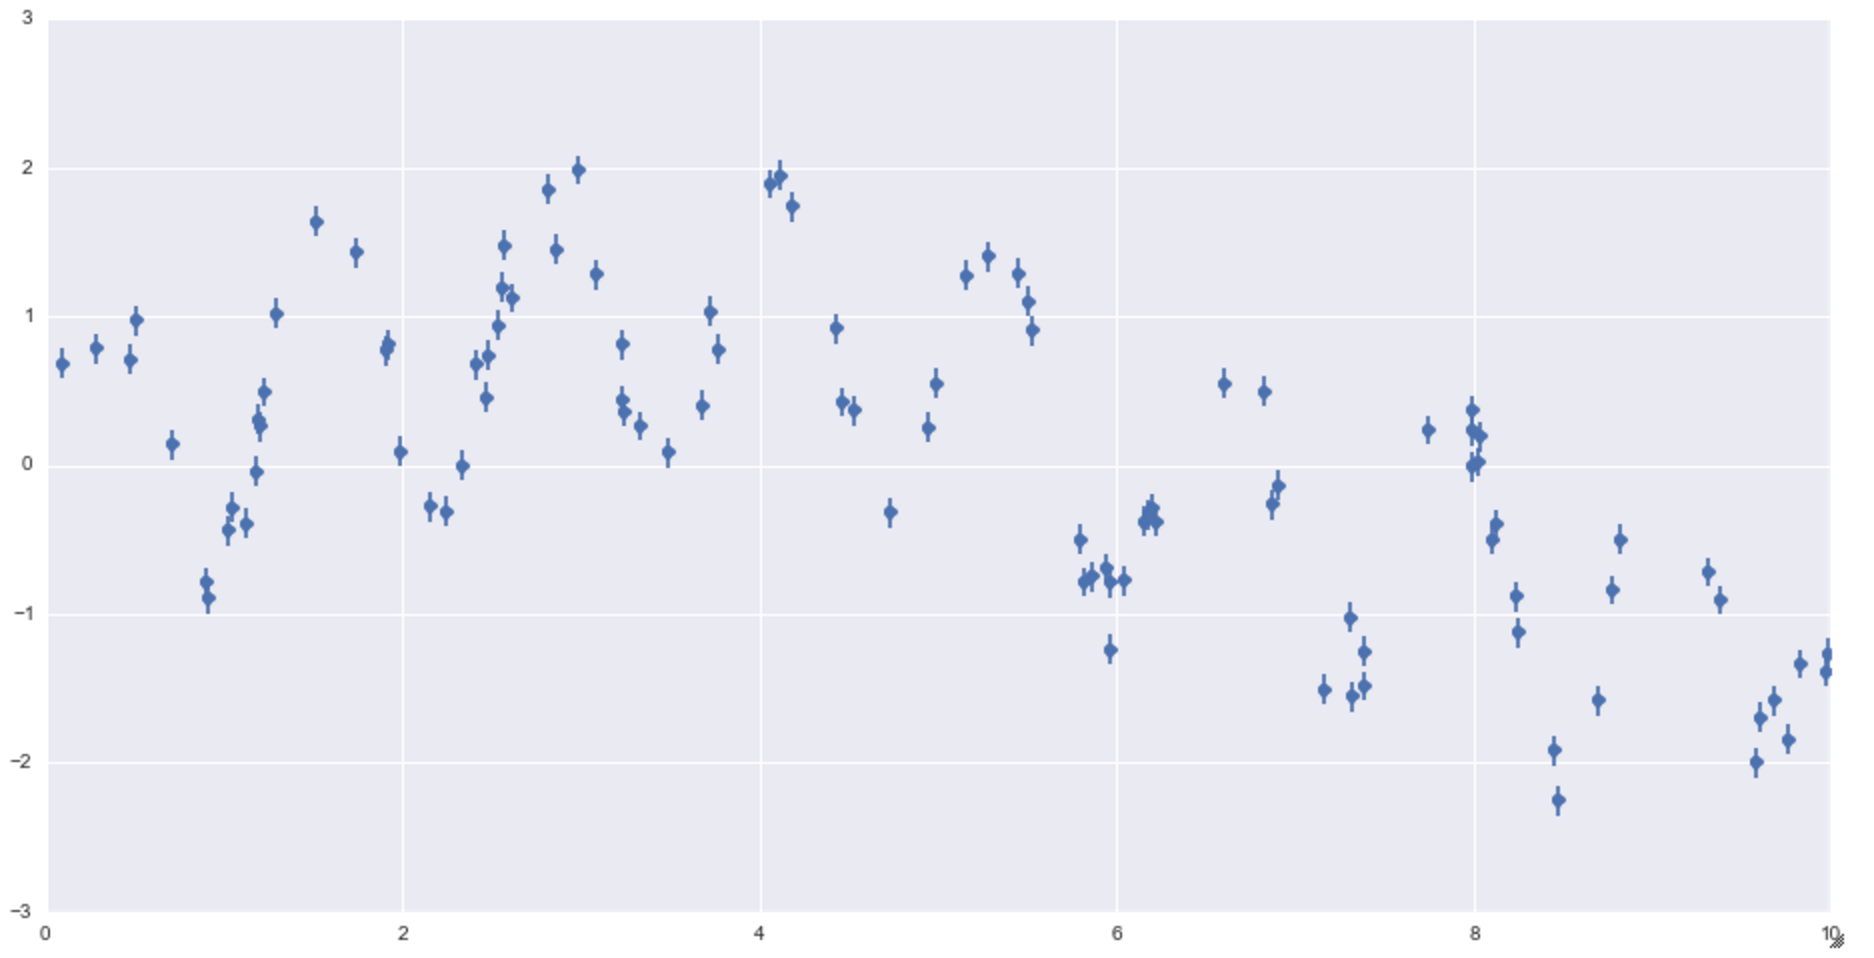
Wave-like dummy data. It gets smaller little by little.
Run with sklearn
{do_random_forest_regression.py}
from sklearn.ensemble import RandomForestRegressor #For random forest regression

#Prepare 1000 pieces of data from 0 to 10 for confirmation
xfit = np.linspace(0, 10, 1000)       #1000 pieces from 0 to 10

#Random forest execution
rfr = RandomForestRegressor(100)  #Instance generation Specify the number of trees to 100
rfr.fit(x[:, None], y)            #Learning execution
yfit = rfr.predict(xfit[:, None]) #Predictive execution

#Get the actual value for result comparison.
ytrue = sin_model(xfit,0) #Feed xfit to the wave generation function and get the result

#Check the result
plt.figure(figsize = (16,8))
plt.errorbar(x, y, 0.1, fmt='o')
plt.plot(xfit, yfit, '-r')                #Predicted plot
plt.plot(xfit, ytrue, '-k', alpha = 0.5)  #Correct answer plot
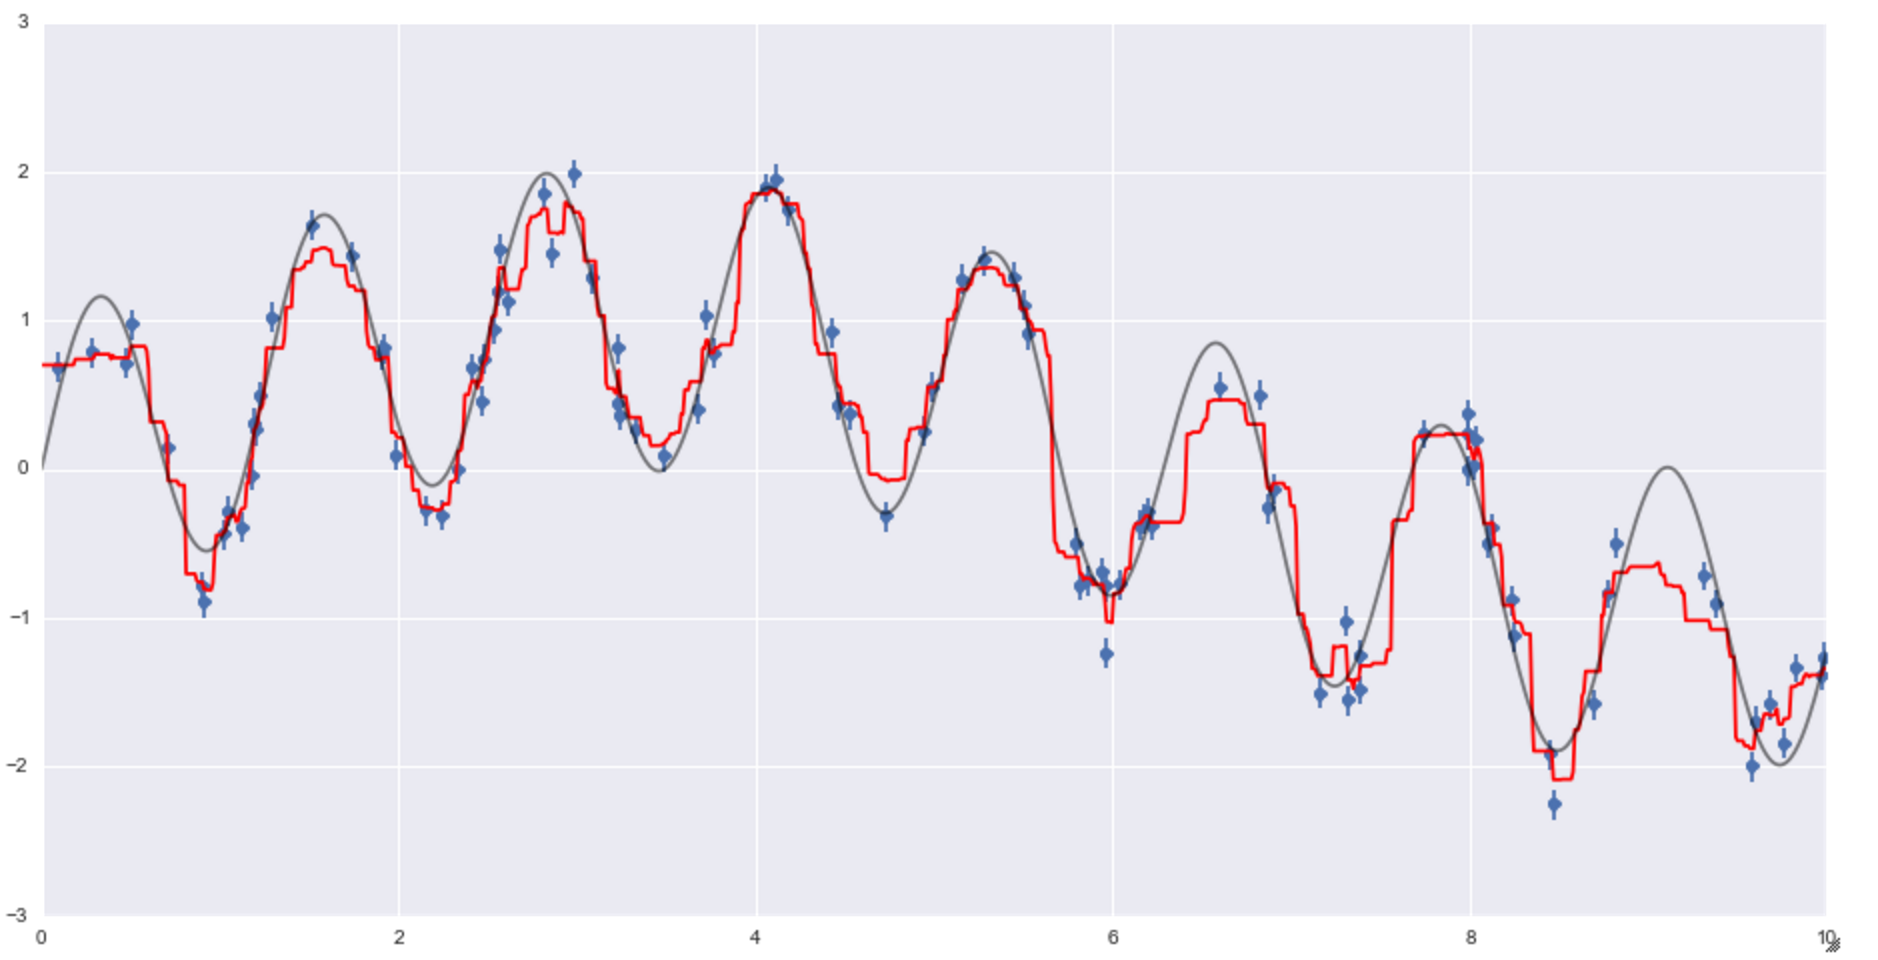
You can see that the red line is the regression line of the prediction, and the result seems to be reasonably good.
Recommended Posts