Create a decision tree from 0 with Python and understand it (5. Information Entropy)
** Create and understand decision trees from scratch in Python ** 1. Overview-2. Python Program Basics-3. Data Analysis Library Pandas-4. Data Structure --5 Information Entropy
For learning AI (machine learning) and data mining, we will understand by creating a decision tree from scratch in Python.
5.1 Information entropy (average amount of information)
When creating a decision tree from data, the ID3 algorithm uses an index called information entropy to determine which attribute should be used for branching to distribute data most efficiently.
First, we define the concept of the amount of information. Intuitively, the amount of information = the complexity of the data. In the decision tree, the data of the same class value is collected each time the branch of the tree is advanced, that is, the complexity of the class value decreases. Therefore, when considering which attribute should be used for branching, it is sufficient to judge by how simple the divided data is.
5.1.1 Defining the amount of information
The amount of information is like the value of the acquired information, and it is assumed that the amount of information about an event with a low probability of occurring, for example, that it occurs, is larger than the amount of information about an event with a high probability of occurring.
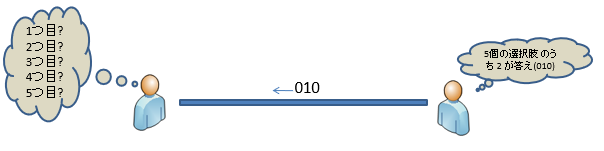
For example, knowing the answer to a five-choice question is more informative than knowing the answer to a two-choice question.
Then, in order to convey the event to others, suppose that it is encoded in binary and sent to the communication line. The amount of communication (bit length) at this time is defined as the amount of information.
When the probability that event E occurs is P (E), the amount of information I (E) that knows that event E has occurred is defined as follows.
I(E) = log_2(1/P(E)) = -log_2P(E)
5.1.2 What is information entropy (average amount of information)?
An attribute has multiple attribute values. For example, there are three types of weather attributes: sunny, cloudy, and rainy. The average value in the attribute of the amount of information obtained from each occurrence probability is called entropy (average amount of information).
It is represented by H in the following formula.
H = -\sum_{E\in\Omega} P(E)\log_2{P(E)}
For example, the entropy of two attributes as shown in the following figure is calculated as follows. The more mixed, chaotic left side has higher entropy, and the black-dominated right side has lower entropy than the left side.
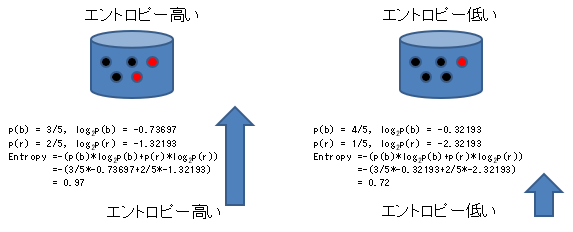
However, even if you don't use complicated formulas, in the case of the above example, it seems that complexity is required by looking at the number of blacks. However, considering, for example, the case of three values with yellow added, the information entropy that can be calculated in the same way for both two values and three values is more unified and easier to handle.
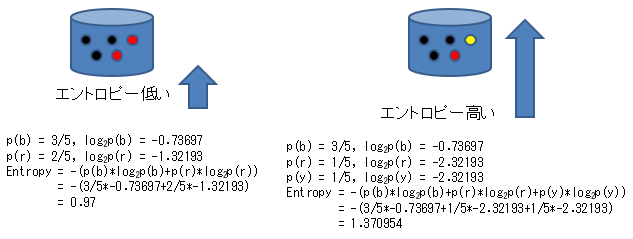
In the example below, it is calculated that even if the number of blacks is the same, the entropy is higher when the rest is divided into red and yellow than when the rest is only red.
This algorithm called ID3 is an algorithm that searches for attribute values that divide the data into groups with lower entropy.
5.2 Calculation of information entropy
Information entropy can be calculated by the following lambda expression with DataFrame as input and entropy value as output.
entropy = lambda df:-reduce(lambda x,y:x+y,map(lambda x:(x/len(df))*math.log2(x/len(df)),df.iloc[:,-1].value_counts()))
This is because the lambda expression is further included in the lambda expression, so I will organize it a little and display it as follows.
entropy = lambda df:-reduce( #4.reduce creates one value from all array elements.
    lambda x,y:x+y,#5.Individual values(9,5)Add the entropy obtained from.
    map( #2.Frequency array(["○":9,"×":5])Number of(9,5)To entropy with the following lamda formula
        lambda x:(x/len(df))*math.log2(x/len(df)),#3.P(E)log2(P(E))To calculate
        df.iloc[:,-1].value_counts() #1.Frequency of last column of DataFrame (eg:["○":9,"×":5])
    )
)
This expression is processed in the following order:
- df.iloc [:, -1] extracts the last column of the DataFrame, and value_counts gives its frequency distribution (example of frequency distribution: ["○": 9, "×": 5]).
- The map converts each of the frequency distribution numbers (eg 9,5) into entropy values.
- (x / len (df)) * math.log2 (x / len (df)) calculates the formula $ P (E) \ log_2 {P (E)} $ for one entropy.
- Use reduce to create a single value from all the elements of an array. For example, it can be used to calculate sums, averages, etc.
- The lamda expression x, y: x + y gives the sum of the two arguments (x, y), that is, the sum of the arrays. This is the sigma part of the entropy expression ($-\ sum_ {E \ in \ Omega} P (E) \ log_2 {P (E)} $). Since the expression has a minus at the beginning, it also has a minus before the program reduce.
5.2.1 Calculation example
The information entropy for the following data is 0.9402859586706309.
d = {"golf":["×","×","○","○","○","×","○","×","○","○","○","○","○","×"]}
#Entropy is 0.9402859586706309
On the other hand, the entropy when the first two x's are changed to ○ and ○ becomes the dominant data (complexity is reduced) is 0.74959525725948.
d = {"golf":["○","○","○","○","○","×","○","×","○","○","○","○","○","×"]}
#Entropy is 0.74959525725948
Below is a list of all the programs that calculate information entropy.
import pandas as pd
from functools import reduce
import math

d = {"golf":["×","×","○","○","○","×","○","×","○","○","○","○","○","×"]}
df0 = pd.DataFrame(d)

entropy = lambda df:-reduce(
    lambda x,y:x+y,
    map(
        lambda x:(x/len(df))*math.log2(x/len(df)),
        df.iloc[:,-1].value_counts()
    )
)

print(entropy(df0)) #Output 0.9402859586706309