[PYTHON] Decision tree (load_iris)
■ Introduction
This time, we will summarize the implementation-plot of the decision tree.
[Target readers]
・ Those who want to learn the basic code in decision trees
・ I don't know the theory in detail, but those who want to see the implementation and give an image, etc.
1. Preparation of module
First, import the required modules.
import numpy as np
import pandas as pd
import matplotlib.pyplot as plt

from sklearn.datasets import load_iris
from sklearn.model_selection import train_test_split
from sklearn.tree import DecisionTreeClassifier
from sklearn.tree import plot_tree
## 2. Data preparation Use the load_iris dataset.
iris = load_iris()
X, y = iris.data[:, [0, 2]], iris.target

print(X.shape)
print(y.shape)

# (150, 2)
# (150,)
Divide into train and test data.
X_train, X_test, y_train, y_test = train_test_split(X, y, test_size = 0.3, random_state = 123)

print(X_train.shape)
print(y_train.shape)
print(X_test.shape)
print(y_train.shape)

# (105, 2)
# (105,)
# (45, 2)
# (45,)
In the decision tree, individual features are processed independently, and data division is scale-independent.
No normalization or standardization is required.
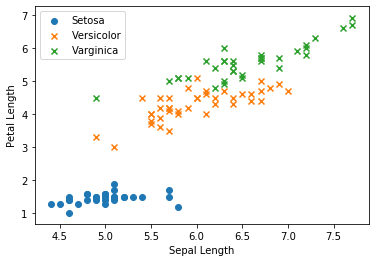
3. Data visualization
Before modeling, let's plot the data.
fig, ax = plt.subplots()

ax.scatter(X_train[y_train == 0, 0], X_train[y_train == 0, 1],
           marker = 'o', label = 'Setosa')

ax.scatter(X_train[y_train == 1, 0], X_train[y_train == 1, 1],
           marker = 'x', label = 'Versicolor')

ax.scatter(X_train[y_train == 2, 0], X_train[y_train == 2, 1],
           marker = 'x', label = 'Varginica')

ax.set_xlabel('Sepal Length')
ax.set_ylabel('Petal Length')
ax.legend(loc = 'best')

plt.show()
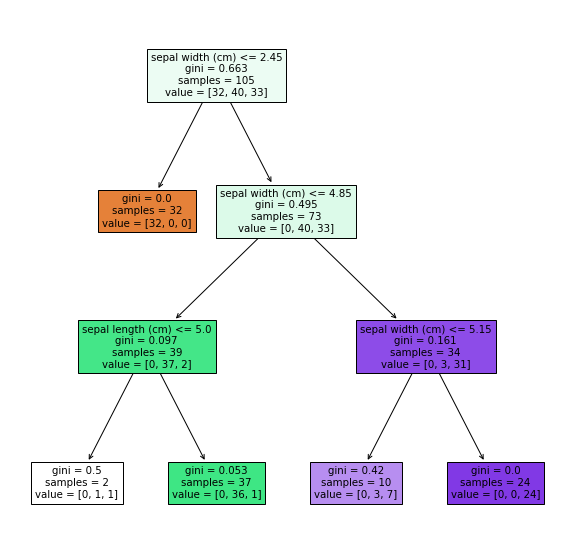
4. Creating a model
Create a model of the decision tree.
tree = DecisionTreeClassifier(max_depth = 3)
tree.fit(X_train, y_train)

'''
DecisionTreeClassifier(ccp_alpha=0.0, class_weight=None, criterion='gini',
                       max_depth=3, max_features=None, max_leaf_nodes=None,
                       min_impurity_decrease=0.0, min_impurity_split=None,
                       min_samples_leaf=1, min_samples_split=2,
                       min_weight_fraction_leaf=0.0, presort='deprecated',
                       random_state=None, splitter='best')

'''
At the same time, I will also visualize it.
fig, ax = plt.subplots(figsize=(10, 10))
plot_tree(tree, feature_names=iris.feature_names, filled=True)
plt.show()
5. Output of predicted value
Make predictions for test data.
y_pred = tree.predict(X_test)

print(y_pred[:10])
print(y_test[:10])

# [2 2 2 1 0 1 1 0 0 1]
# [1 2 2 1 0 2 1 0 0 1]
0:Setosa 1:Versicolor 2:Verginica
6. Performance evaluation
Find the correct answer rate in this classification prediction.
print('{:.3f}'.format(tree.score(X_test, y_test)))

# 0.956
## ■ Finally This time, based on the steps 1 to 6 above, we created and evaluated a model of the decision tree. We hope that it will be of some help to beginners.
## ■ References ・ [New data analysis textbook using Python](https://www.shoeisha.co.jp/book/detail/9784798158341)
Recommended Posts